QUESTION IMAGE
Question
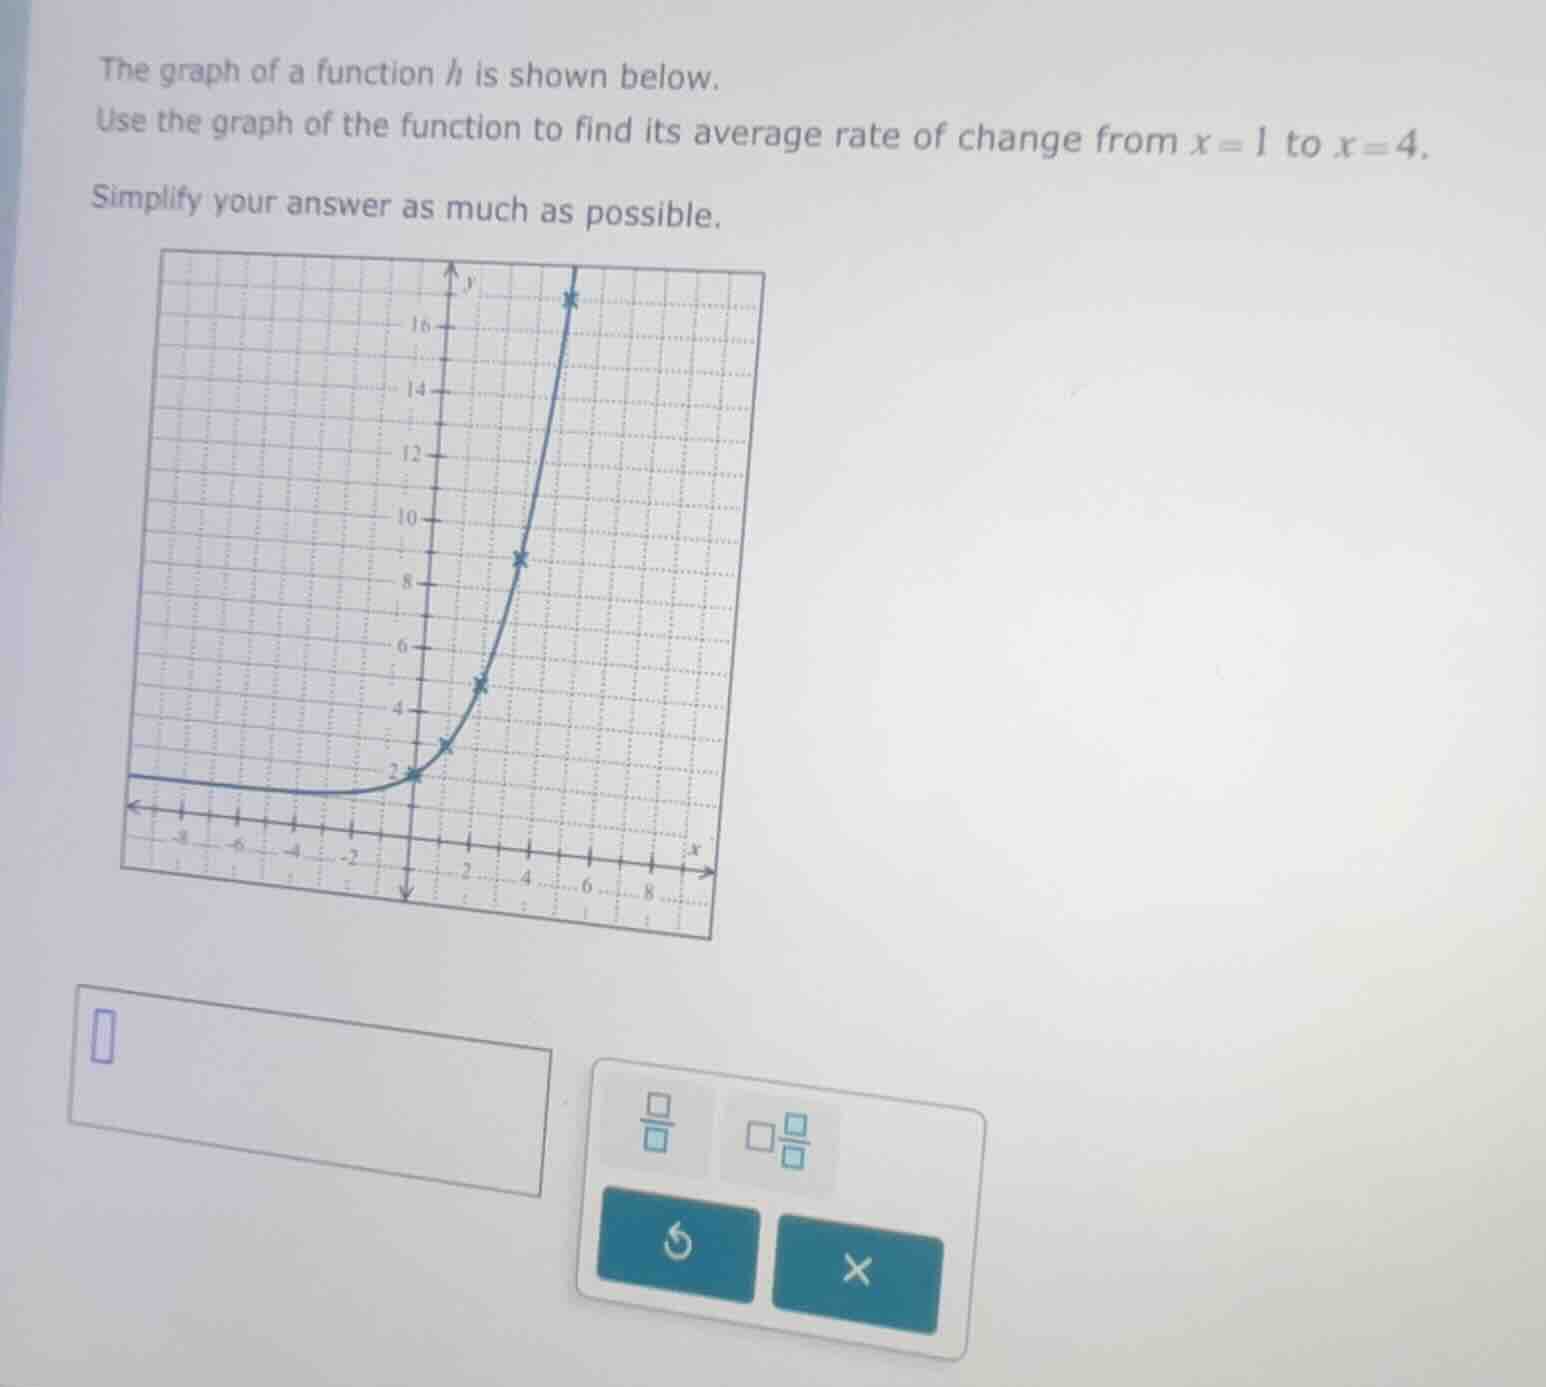
the graph of a function ( h ) is shown below.
use the graph of the function to find its average rate of change from ( x = 1 ) to ( x = 4 ).
simplify your answer as much as possible.
Step1: Recall the formula for average rate of change
The average rate of change of a function \( h(x) \) from \( x = a \) to \( x = b \) is given by \( \frac{h(b)-h(a)}{b - a} \). Here, \( a = 1 \) and \( b = 4 \), so we need to find \( h(1) \) and \( h(4) \) from the graph.
Step2: Find \( h(1) \) from the graph
Looking at the graph, when \( x = 1 \), we can see that the point on the graph has a \( y \)-value (which is \( h(1) \)) of 3 (by observing the grid, moving 1 unit along the x - axis from 0, the corresponding y - value is 3).
Step3: Find \( h(4) \) from the graph
When \( x = 4 \), the point on the graph has a \( y \)-value (which is \( h(4) \)) of 9 (by observing the grid, moving 4 units along the x - axis from 0, the corresponding y - value is 9).
Step4: Calculate the average rate of change
Using the formula \( \frac{h(4)-h(1)}{4 - 1} \), substitute \( h(4)=9 \) and \( h(1) = 3 \):
\[
\frac{9 - 3}{4 - 1}=\frac{6}{3}=2
\]

Snap & solve any problem in the app
Get step-by-step solutions on Sovi AI
Photo-based solutions with guided steps
Explore more problems and detailed explanations
2