QUESTION IMAGE
Question
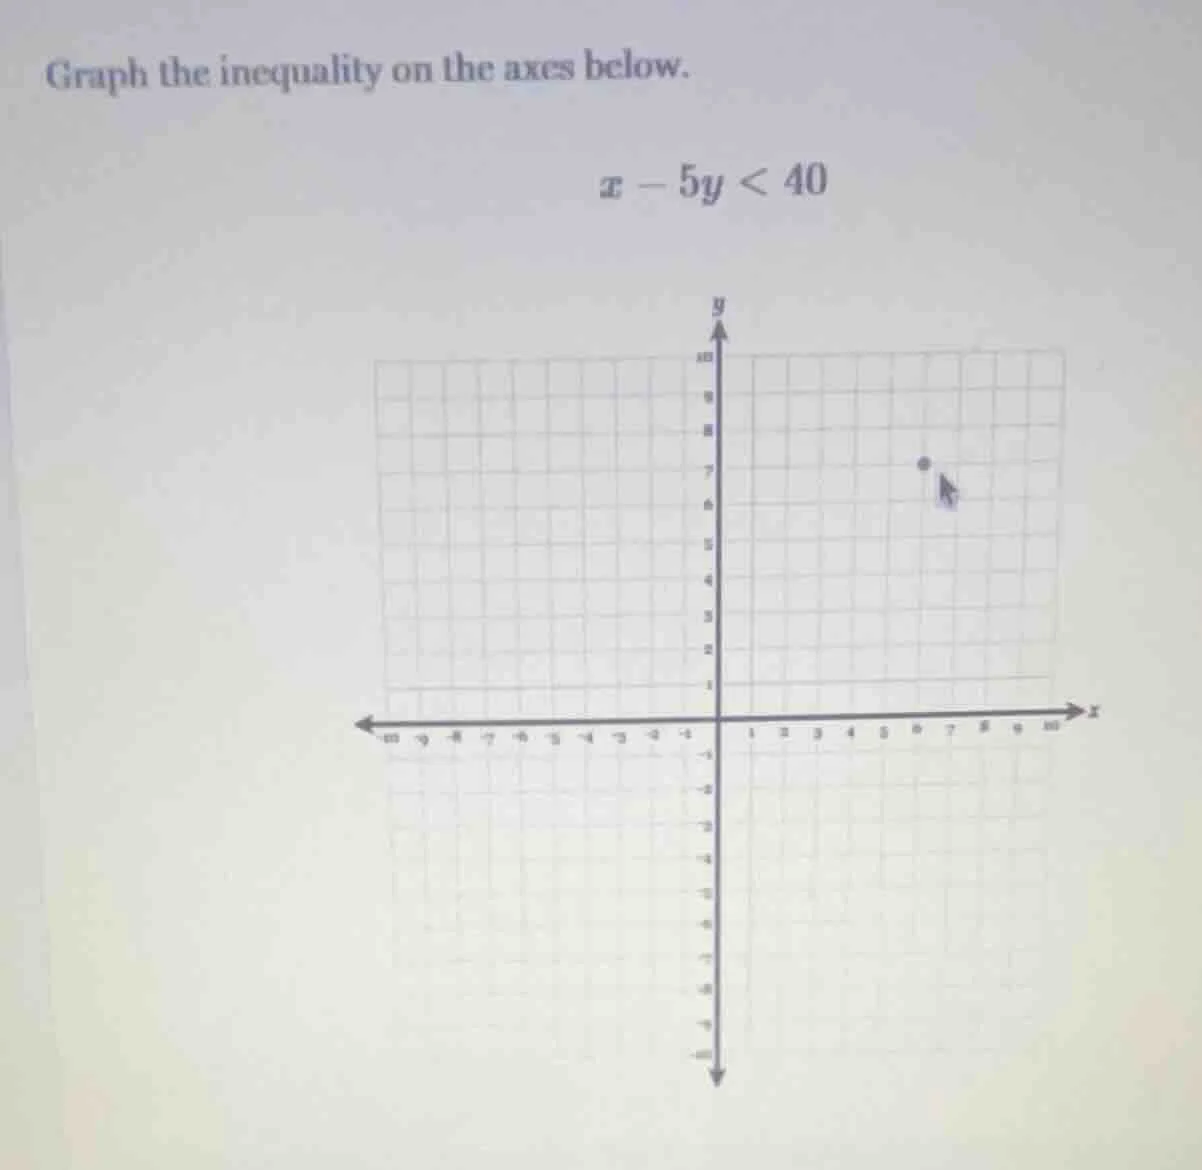
graph the inequality on the axes below.
( x - 5y < 40 )
Step1: Rewrite the inequality in slope - intercept form
We start with the inequality \(x - 5y<40\). First, we want to solve for \(y\).
Subtract \(x\) from both sides: \(- 5y<-x + 40\).
Then, divide each term by \(-5\). Remember that when we divide or multiply an inequality by a negative number, the direction of the inequality sign changes. So we get \(y>\frac{1}{5}x-8\).
Step2: Graph the boundary line
The boundary line is the equation \(y = \frac{1}{5}x-8\). This is a linear equation in slope - intercept form \(y=mx + b\), where the slope \(m=\frac{1}{5}\) and the \(y\) - intercept \(b=- 8\).
- To find the \(y\) - intercept, we set \(x = 0\). Then \(y=\frac{1}{5}(0)-8=-8\), so the line passes through the point \((0,-8)\).
- To find another point, we can use the slope. The slope \(\frac{1}{5}\) means that for every 5 units we move to the right (increase \(x\) by 5), we move up 1 unit (increase \(y\) by 1). So from the point \((0,-8)\), if we move \(x = 5\), then \(y=-8 + 1=-7\), so the line also passes through the point \((5,-7)\).
Since the inequality is \(y>\frac{1}{5}x - 8\) (not \(y\geq\frac{1}{5}x-8\)), the boundary line should be a dashed line (because the points on the line are not included in the solution set of the inequality).
Step3: Determine the region to shade
We test a point that is not on the line. A common test point is the origin \((0,0)\).
Substitute \(x = 0\) and \(y = 0\) into the inequality \(y>\frac{1}{5}x-8\). We get \(0>\frac{1}{5}(0)-8\), which simplifies to \(0>-8\). This is a true statement.
So we shade the region that contains the origin \((0,0)\) (the region above the dashed line \(y=\frac{1}{5}x - 8\)).
(Note: Since the problem asks to graph the inequality, the final answer is the graph with a dashed line \(y = \frac{1}{5}x-8\) and the region above the line shaded.)

Snap & solve any problem in the app
Get step-by-step solutions on Sovi AI
Photo-based solutions with guided steps
Explore more problems and detailed explanations
The graph has a dashed line \(y=\frac{1}{5}x - 8\) (passing through \((0,-8)\) and \((5,-7)\) etc.) and the region above the line is shaded.