QUESTION IMAGE
Question
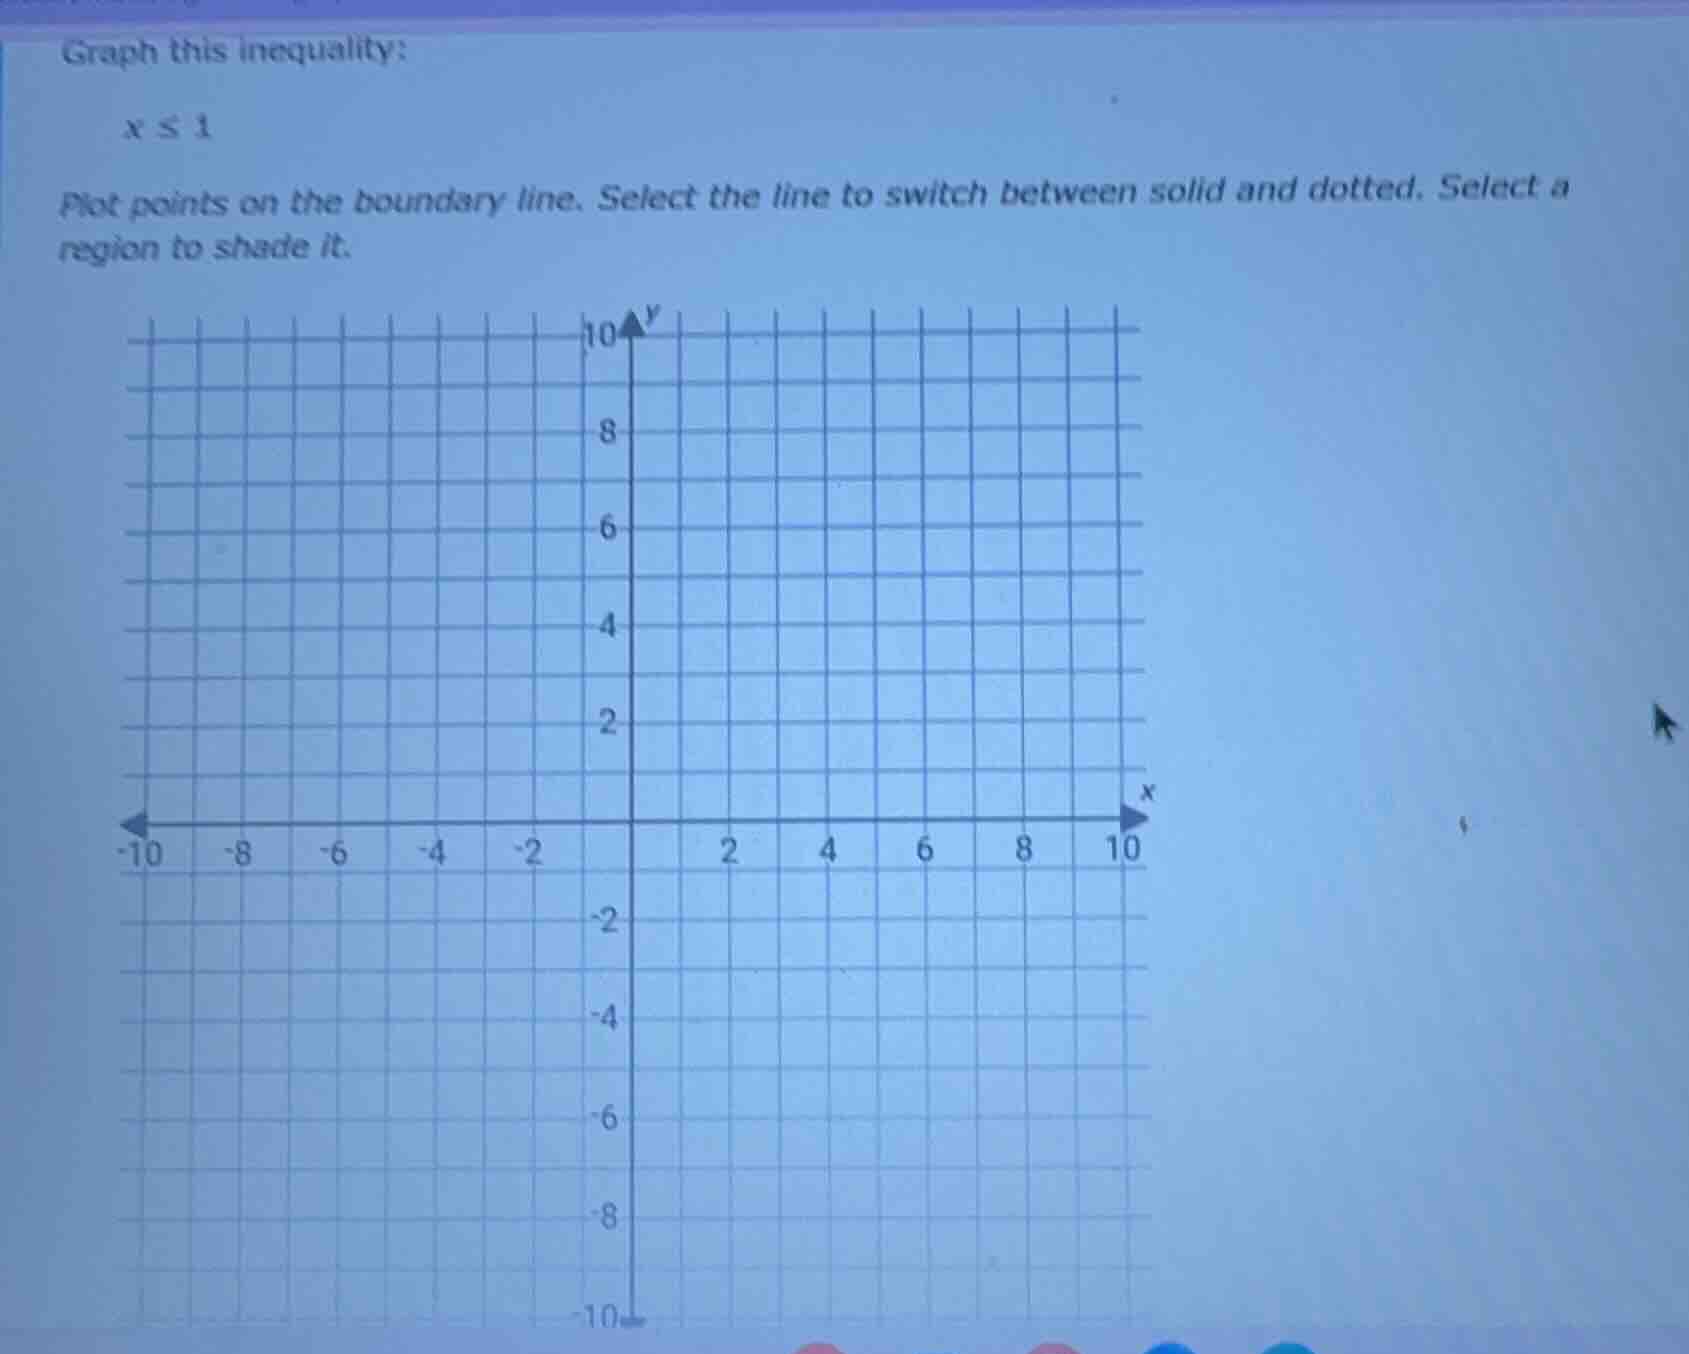
graph this inequality:
x ≤ 1
plot points on the boundary line. select the line to switch between solid and dotted. select a region to shade it.
Step1: Identify the boundary line
The inequality is \( x \leq 1 \). The boundary line is \( x = 1 \), which is a vertical line. Since the inequality is "less than or equal to", the line should be solid (because the points on the line are included in the solution set).
Step2: Plot the boundary line
To plot \( x = 1 \), we can choose any \( y \)-values. For example, when \( y = 0 \), the point is \( (1, 0) \); when \( y = 2 \), the point is \( (1, 2) \); when \( y = -3 \), the point is \( (1, -3) \). Plot these points (or any other points with \( x = 1 \)) on the graph.
Step3: Determine the region to shade
We need to shade the region where \( x \leq 1 \). This is the region to the left of the line \( x = 1 \) (since all points with \( x \)-coordinate less than or equal to 1 satisfy the inequality).
To graph \( x \leq 1 \):
- Draw a solid vertical line at \( x = 1 \) (plot points like \( (1, 0) \), \( (1, 2) \), \( (1, -3) \) on this line).
- Shade the region to the left of the line \( x = 1 \) (all points where \( x \)-value is less than or equal to 1).
(Note: Since this is a text-based explanation, the actual graphing would be done on the provided coordinate plane by plotting the boundary line points, setting the line to solid, and shading the left region.)

Snap & solve any problem in the app
Get step-by-step solutions on Sovi AI
Photo-based solutions with guided steps
Explore more problems and detailed explanations
Step1: Identify the boundary line
The inequality is \( x \leq 1 \). The boundary line is \( x = 1 \), which is a vertical line. Since the inequality is "less than or equal to", the line should be solid (because the points on the line are included in the solution set).
Step2: Plot the boundary line
To plot \( x = 1 \), we can choose any \( y \)-values. For example, when \( y = 0 \), the point is \( (1, 0) \); when \( y = 2 \), the point is \( (1, 2) \); when \( y = -3 \), the point is \( (1, -3) \). Plot these points (or any other points with \( x = 1 \)) on the graph.
Step3: Determine the region to shade
We need to shade the region where \( x \leq 1 \). This is the region to the left of the line \( x = 1 \) (since all points with \( x \)-coordinate less than or equal to 1 satisfy the inequality).
To graph \( x \leq 1 \):
- Draw a solid vertical line at \( x = 1 \) (plot points like \( (1, 0) \), \( (1, 2) \), \( (1, -3) \) on this line).
- Shade the region to the left of the line \( x = 1 \) (all points where \( x \)-value is less than or equal to 1).
(Note: Since this is a text-based explanation, the actual graphing would be done on the provided coordinate plane by plotting the boundary line points, setting the line to solid, and shading the left region.)