QUESTION IMAGE
Question
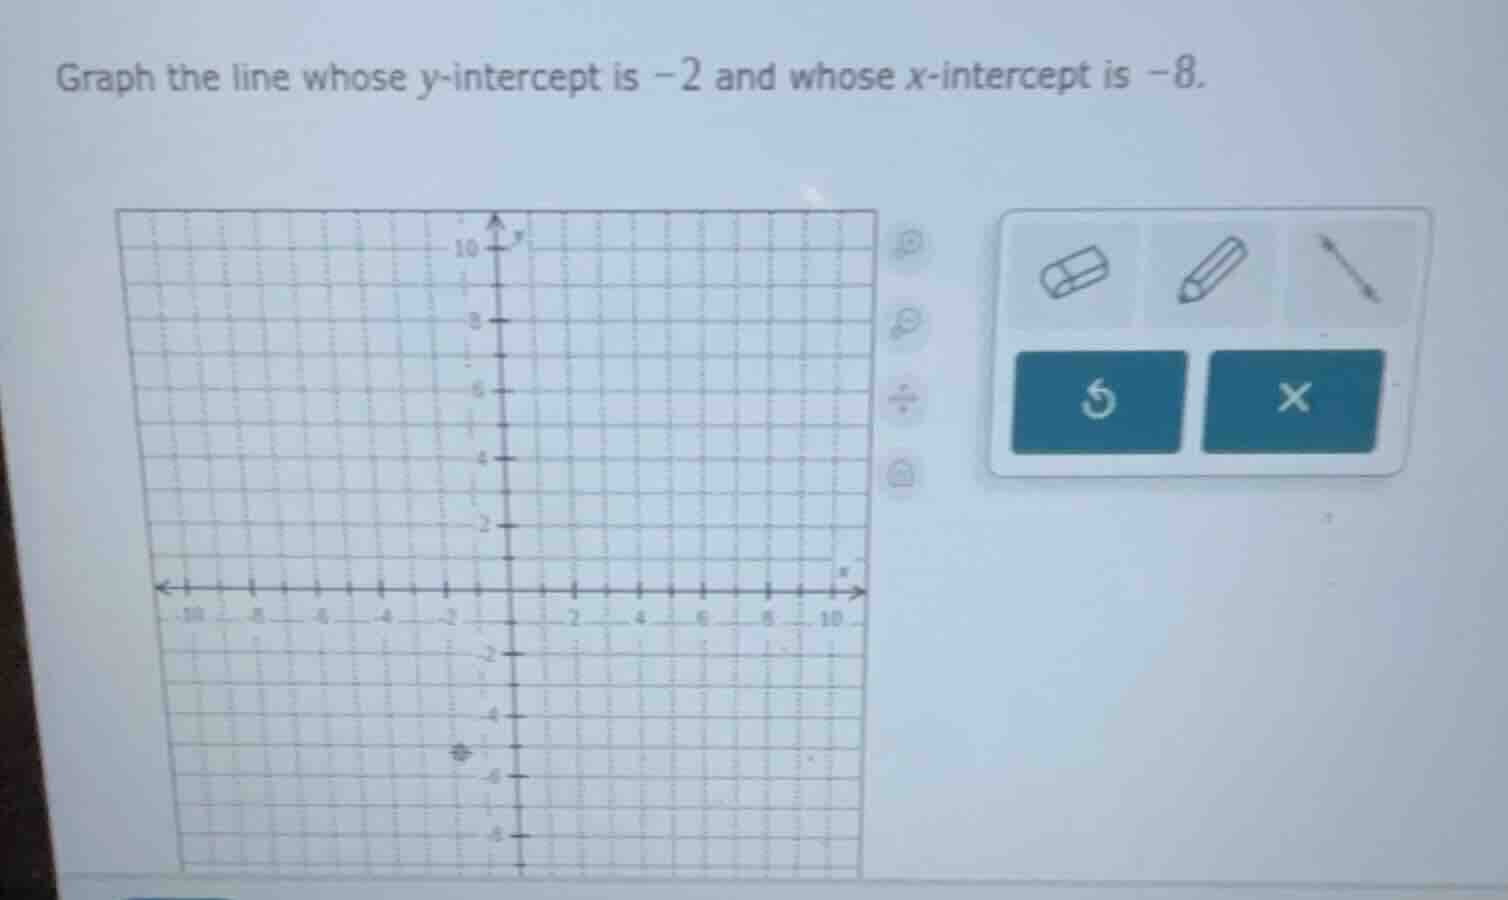
graph the line whose y-intercept is -2 and whose x-intercept is -8.
Step1: Identify intercept points
The y - intercept is - 2, so the point is \((0, - 2)\). The x - intercept is - 8, so the point is \((-8, 0)\).
Step2: Plot the points
On the coordinate grid, find the point \((0, - 2)\) (on the y - axis, 2 units below the origin) and the point \((-8, 0)\) (on the x - axis, 8 units to the left of the origin).
Step3: Draw the line
Use a straight - edge (the pencil tool in the given interface) to draw a line connecting the two plotted points \((0, - 2)\) and \((-8, 0)\) and extend it in both directions.

Snap & solve any problem in the app
Get step-by-step solutions on Sovi AI
Photo-based solutions with guided steps
Explore more problems and detailed explanations
To graph the line, plot the points \((0, - 2)\) (y - intercept) and \((-8, 0)\) (x - intercept) on the coordinate grid and draw a straight line through them, extending the line in both directions.