QUESTION IMAGE
Question
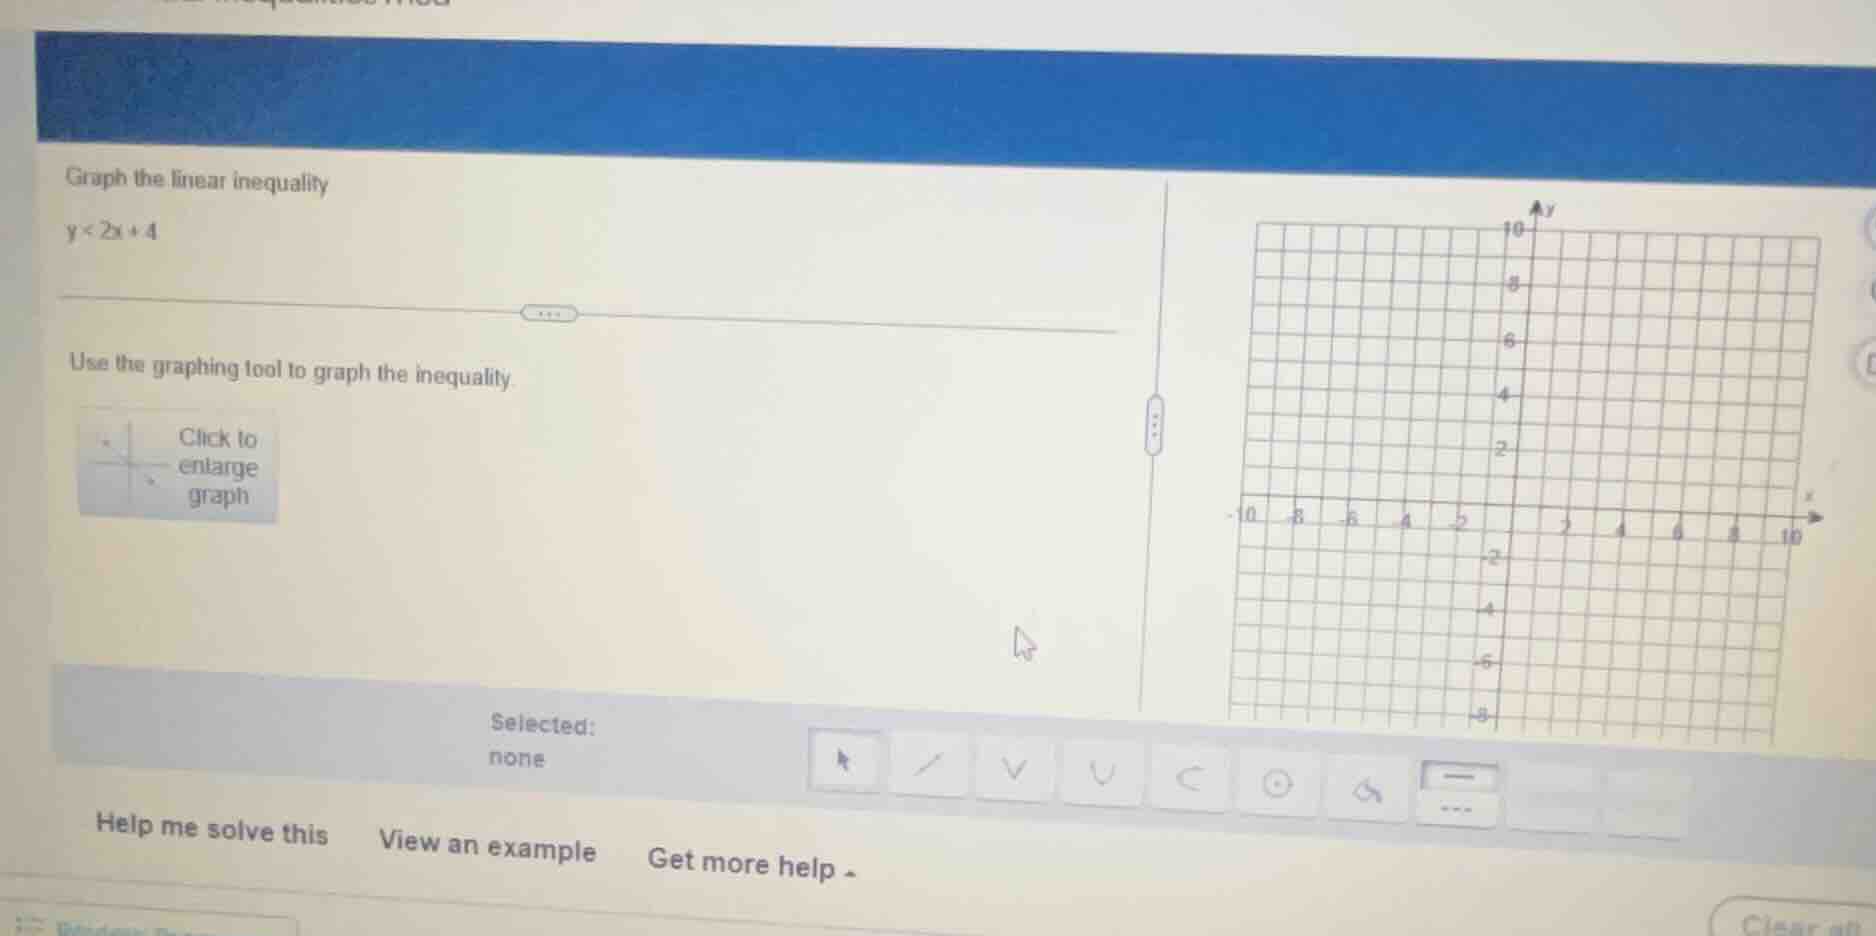
graph the linear inequality
y < 2x + 4
use the graphing tool to graph the inequality.
click to enlarge graph
Step1: Identify boundary line
The inequality $y < 2x + 4$ has a boundary line $y = 2x + 4$. Since the inequality is $<$ (not $\leq$), the line will be dashed.
Step2: Find intercepts of boundary
- y-intercept: Set $x=0$, so $y=2(0)+4=4$. Point: $(0, 4)$
- x-intercept: Set $y=0$, so $0=2x+4 \implies x=-2$. Point: $(-2, 0)$
Step3: Determine shaded region
Test a point not on the line, e.g., $(0,0)$:
$0 < 2(0)+4 \implies 0 < 4$, which is true. So shade the region containing $(0,0)$ (below the dashed line).

Snap & solve any problem in the app
Get step-by-step solutions on Sovi AI
Photo-based solutions with guided steps
Explore more problems and detailed explanations
- Draw a dashed line through points $(-2, 0)$ and $(0, 4)$ (representing $y=2x+4$).
- Shade the entire region below this dashed line.