QUESTION IMAGE
Question
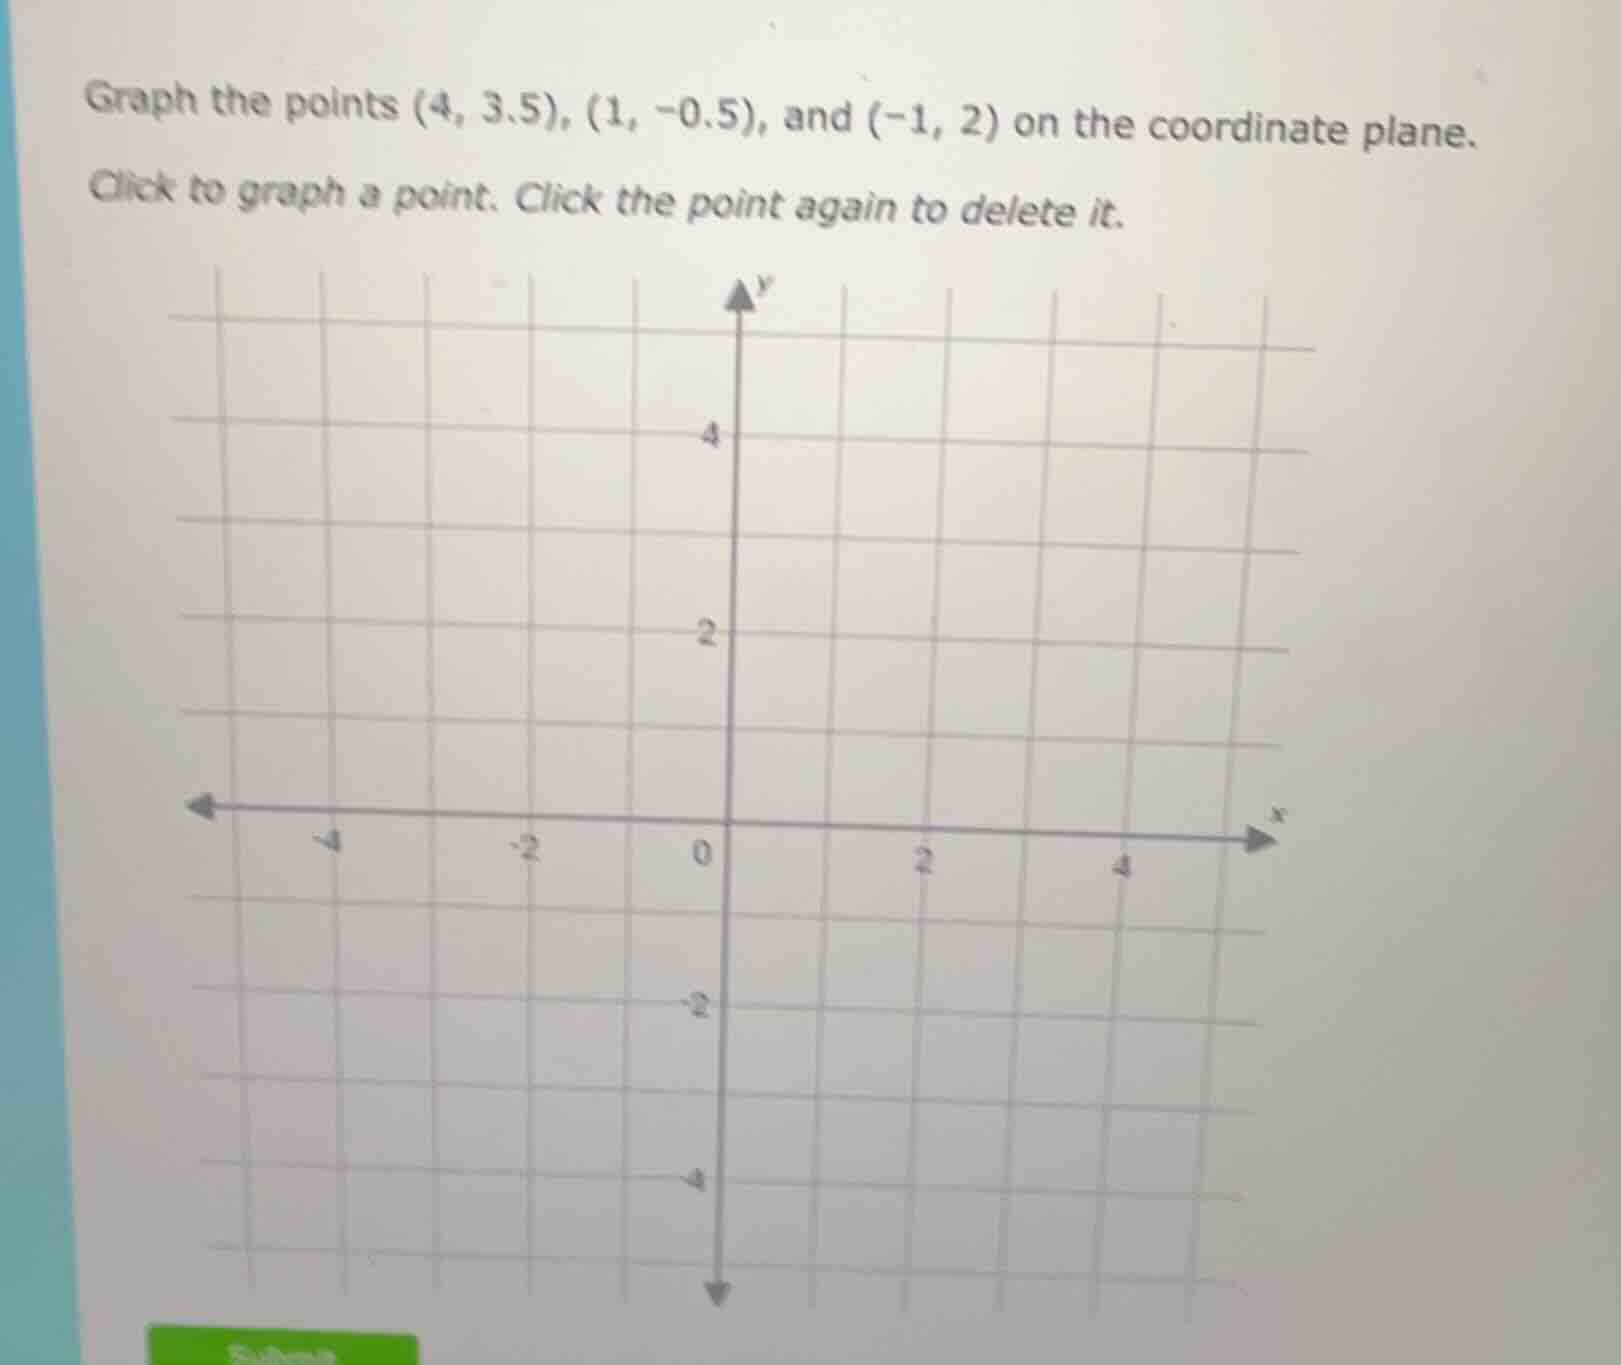
graph the points (4, 3.5), (1, -0.5), and (-1, 2) on the coordinate plane. click to graph a point. click the point again to delete it.
Step1: Graph (4, 3.5)
For the point \((4, 3.5)\), move 4 units to the right along the x - axis (since the x - coordinate is 4) and then 3.5 units up along the y - axis (since the y - coordinate is 3.5).
Step2: Graph (1, - 0.5)
For the point \((1, - 0.5)\), move 1 unit to the right along the x - axis (x - coordinate = 1) and then 0.5 units down along the y - axis (y - coordinate=-0.5, so we move below the x - axis).
Step3: Graph (-1, 2)
For the point \((-1, 2)\), move 1 unit to the left along the x - axis (x - coordinate=-1) and then 2 units up along the y - axis (y - coordinate = 2).
(Note: Since this is a graphing task, the final answer is the visual representation of these points on the coordinate plane as described in the steps above. If we were to describe the positions: \((4, 3.5)\) is in the first quadrant, 4 right and 3.5 up; \((1, - 0.5)\) is in the fourth quadrant, 1 right and 0.5 down; \((-1, 2)\) is in the second quadrant, 1 left and 2 up.)

Snap & solve any problem in the app
Get step-by-step solutions on Sovi AI
Photo-based solutions with guided steps
Explore more problems and detailed explanations
The points \((4, 3.5)\), \((1, - 0.5)\), and \((-1, 2)\) are graphed on the coordinate plane as per the steps: \((4, 3.5)\) at (4, 3.5), \((1, - 0.5)\) at (1, - 0.5), \((-1, 2)\) at (-1, 2).