QUESTION IMAGE
Question
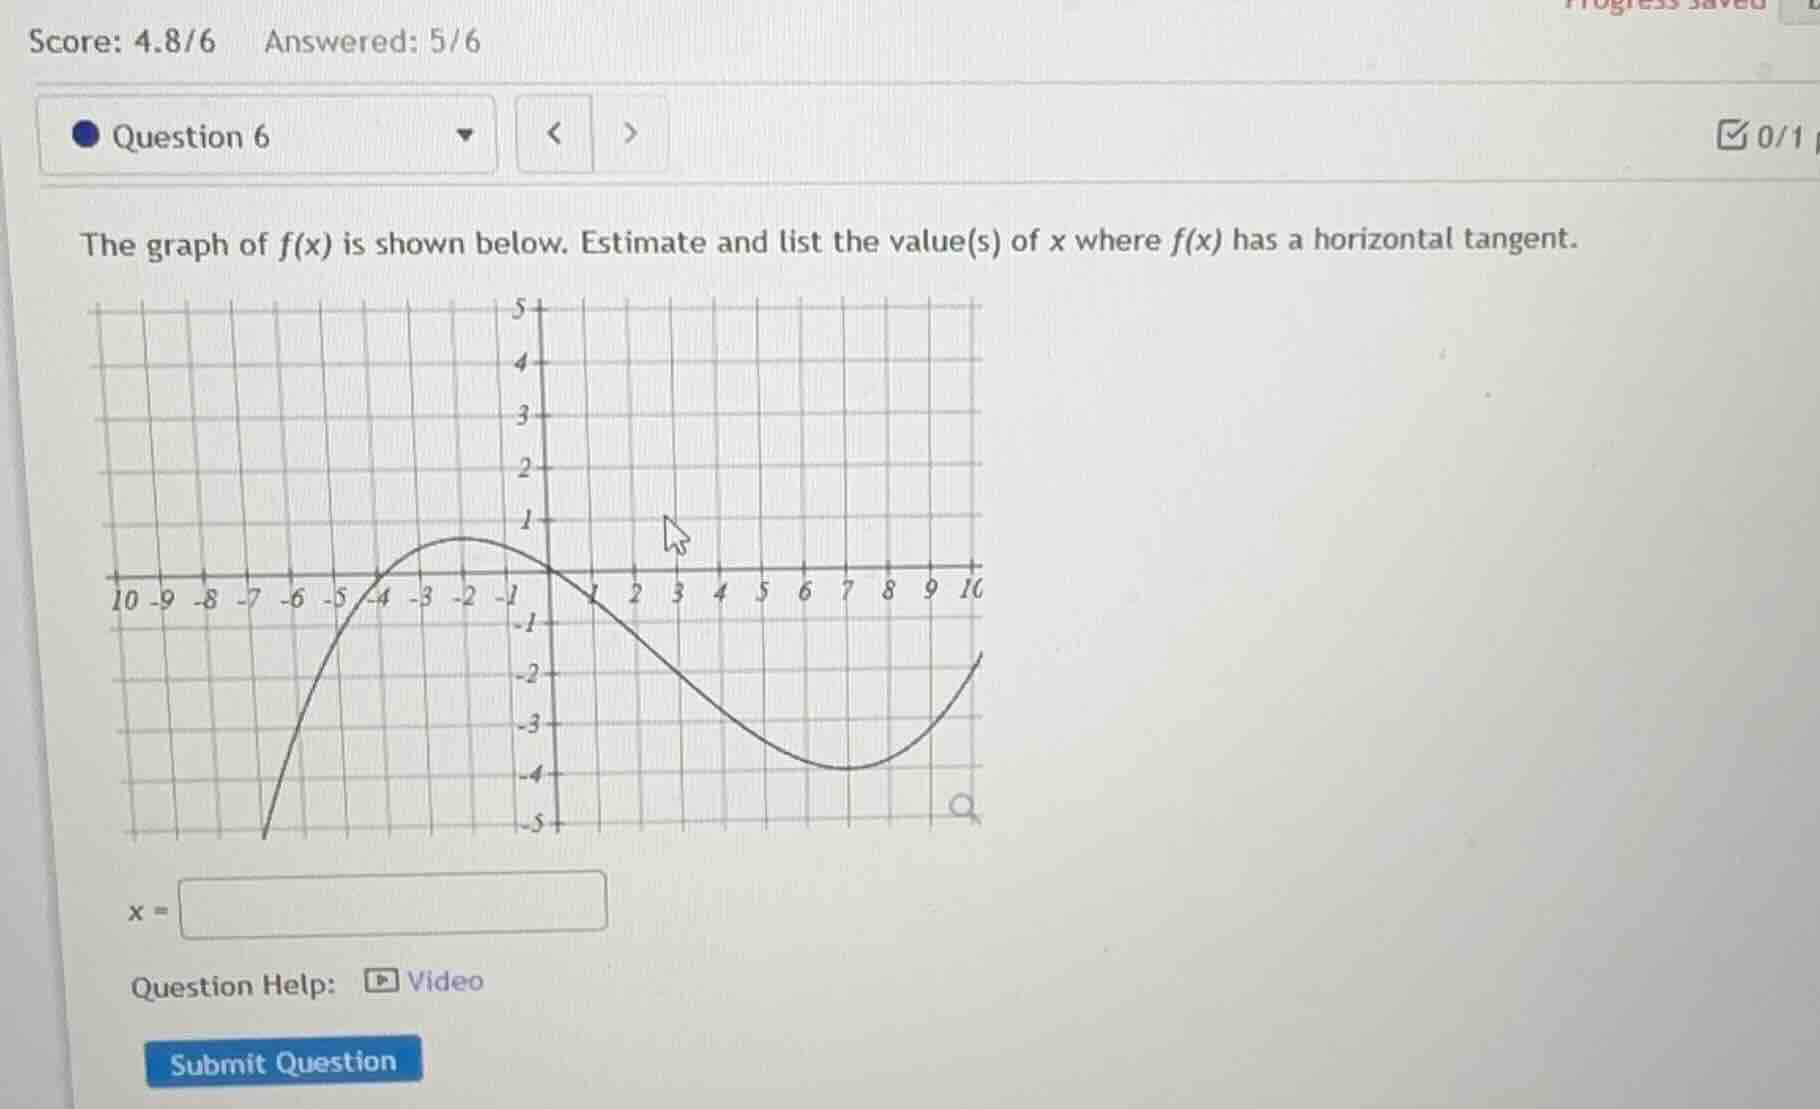
the graph of f(x) is shown below. estimate and list the value(s) of x where f(x) has a horizontal tangent.
Step1: Recall the concept of horizontal tangent
A function \( f(x) \) has a horizontal tangent at a point where the derivative \( f'(x) = 0 \). Geometrically, this corresponds to the peak (local maximum) or trough (local minimum) of the graph, where the slope of the tangent line is zero (horizontal).
Step2: Analyze the graph
Looking at the graph of \( f(x) \):
- There is a local maximum (the peak of the curve) and a local minimum (the trough of the curve).
- For the local maximum: By observing the x - coordinate of the peak, we can see that it occurs at \( x=-2 \) (since the peak is above \( x = - 2 \) on the x - axis).
- For the local minimum: By observing the x - coordinate of the trough, we can see that it occurs at \( x = 8 \) (since the trough is below \( x=8 \) on the x - axis).

Snap & solve any problem in the app
Get step-by-step solutions on Sovi AI
Photo-based solutions with guided steps
Explore more problems and detailed explanations
\( x=-2, 8 \)