QUESTION IMAGE
Question
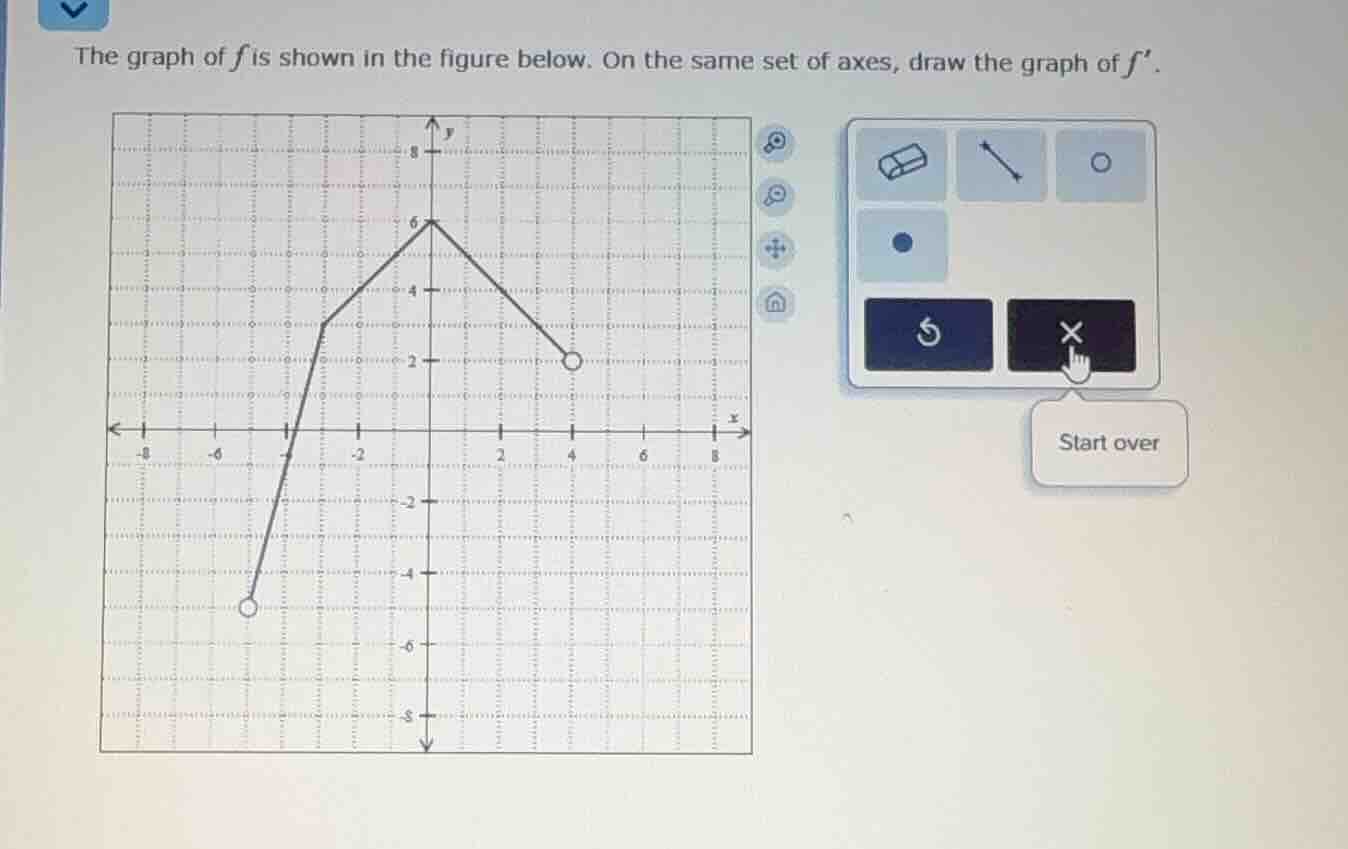
the graph of ( f ) is shown in the figure below. on the same set of axes, draw the graph of ( f ).
Step1: Identify intervals of f(x)
The function $f(x)$ has 3 linear segments:
- $x \in (-4, 0)$: increasing line from $(-4, -5)$ to $(0, 6)$
- $x \in (0, 4)$: decreasing line from $(0, 6)$ to $(4, 2)$
- Note: Open circles mean endpoints are not included.
Step2: Calculate slope for first interval
Slope is rate of change:
$\text{Slope} = \frac{6 - (-5)}{0 - (-4)} = \frac{11}{4} = 2.75$
So $f'(x) = 2.75$ for $x \in (-4, 0)$
Step3: Calculate slope for second interval
Slope is rate of change:
$\text{Slope} = \frac{2 - 6}{4 - 0} = \frac{-4}{4} = -1$
So $f'(x) = -1$ for $x \in (0, 4)$
Step4: Plot f'(x)
- For $x \in (-4, 0)$: draw a horizontal line at $y=2.75$, with open circles at $x=-4$ and $x=0$
- For $x \in (0, 4)$: draw a horizontal line at $y=-1$, with open circles at $x=0$ and $x=4$

Snap & solve any problem in the app
Get step-by-step solutions on Sovi AI
Photo-based solutions with guided steps
Explore more problems and detailed explanations
The graph of $f'(x)$ consists of two horizontal segments:
- A horizontal line at $y=\frac{11}{4}$ (or 2.75) spanning the open interval $(-4, 0)$
- A horizontal line at $y=-1$ spanning the open interval $(0, 4)$
(Each segment has open circles at its endpoints, matching the open circles of the original function's segments.)