QUESTION IMAGE
Question
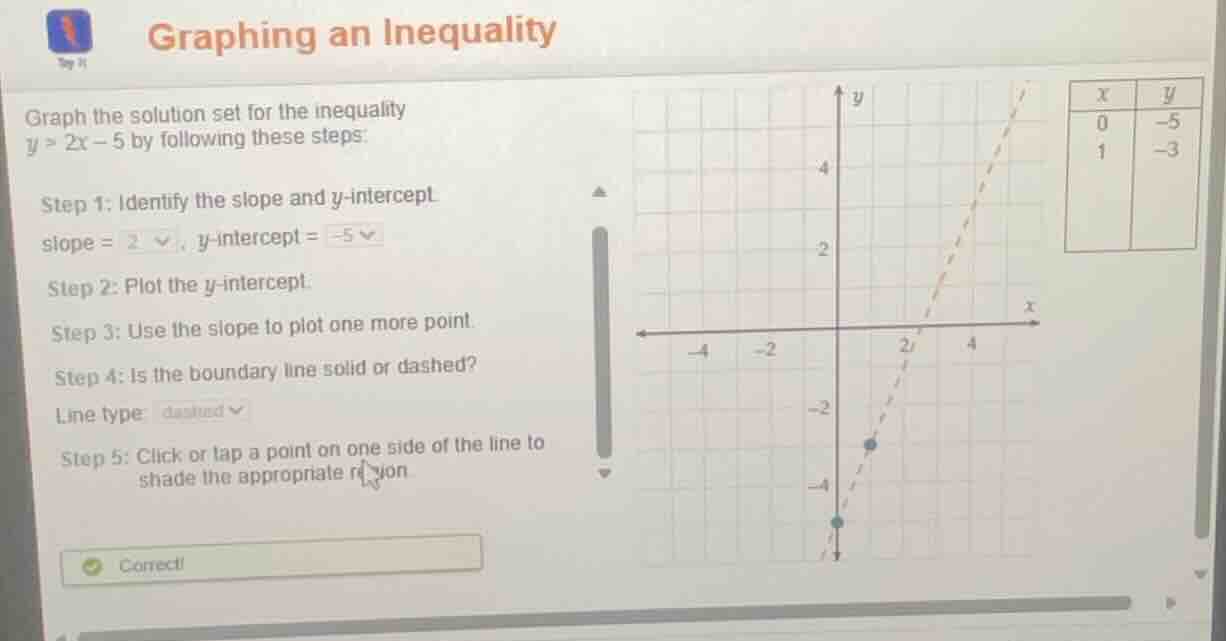
graphing an inequality
graph the solution set for the inequality
y > 2x − 5 by following these steps:
step 1: identify the slope and y-intercept.
slope = 2, y-intercept = -5
step 2: plot the y-intercept.
step 3: use the slope to plot one more point.
step 4: is the boundary line solid or dashed?
line type: dashed
step 5: click or tap a point on one side of the line to
shade the appropriate region.
correct!
Step1: Identify slope & y-intercept
The inequality $y > 2x - 5$ follows the slope-intercept form $y=mx+b$, where $m$ is slope, $b$ is y-intercept.
Slope $m=2$, y-intercept $b=-5$
Step2: Plot y-intercept
The y-intercept is the point $(0, -5)$, plot this on the graph.
Step3: Use slope for 2nd point
Slope $\frac{\Delta y}{\Delta x}=2=\frac{2}{1}$. From $(0,-5)$, move 1 right, 2 up: $(0+1, -5+2)=(1,-3)$. Plot this point.
Step4: Choose boundary line type
Since the inequality is $>$ (not $\geq$), the boundary line is dashed. Draw a dashed line through the two points.
Step5: Determine shading region
Test a point not on the line, e.g., $(0,0)$:
$0 > 2(0)-5 \implies 0 > -5$, which is true. Shade the region containing $(0,0)$ (above the dashed line).

Snap & solve any problem in the app
Get step-by-step solutions on Sovi AI
Photo-based solutions with guided steps
Explore more problems and detailed explanations
The solution set is the region above the dashed line $y=2x-5$, with the dashed line passing through $(0,-5)$ and $(1,-3)$.