QUESTION IMAGE
Question
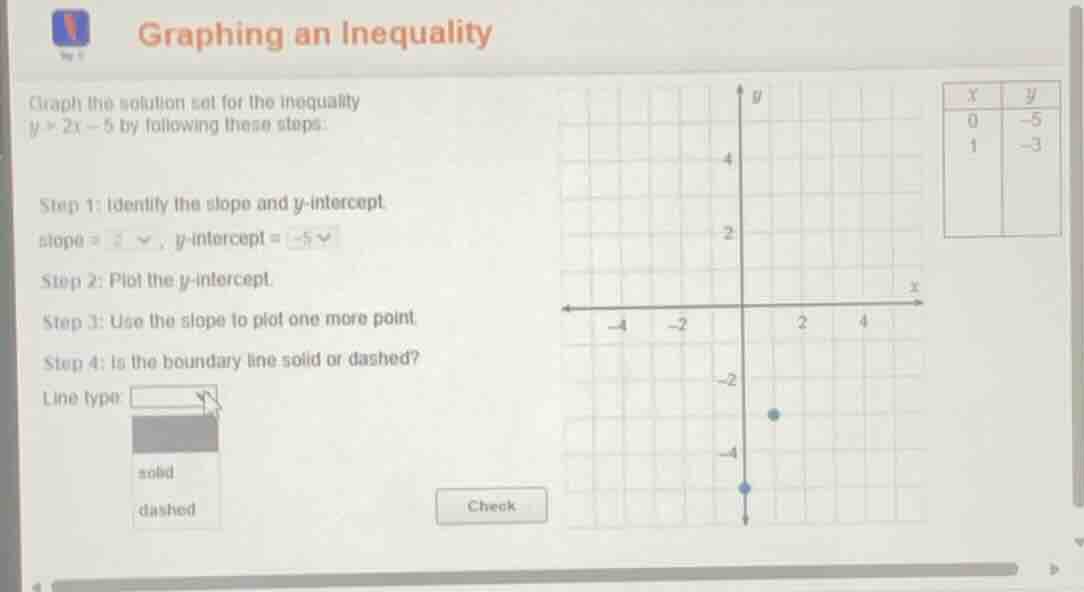
graphing an inequality
graph the solution set for the inequality
( y > 2x - 5 ) by following these steps:
step 1: identify the slope and ( y )-intercept
slope = ( 2 ), ( y )-intercept = ( -5 )
step 2: plot the ( y )-intercept.
step 3: use the slope to plot one more point.
step 4: is the boundary line solid or dashed?
line type:
( \begin{array}{c}\text{solid}\\text{dashed}end{array} )
(there is a coordinate plane and a table with ( x ) and ( y ) values: when ( x = 0 ), ( y = -5 ); when ( x = 1 ), ( y = -3 ))
Step1: Analyze inequality symbol
The inequality is $y > 2x - 5$. The $>$ symbol means the boundary line is not part of the solution set.
Step2: Determine line type
For inequalities with $>$ or $<$, the boundary line is dashed (solid is used for $\geq$ or $\leq$).

Snap & solve any problem in the app
Get step-by-step solutions on Sovi AI
Photo-based solutions with guided steps
Explore more problems and detailed explanations
dashed