QUESTION IMAGE
Question
graphs
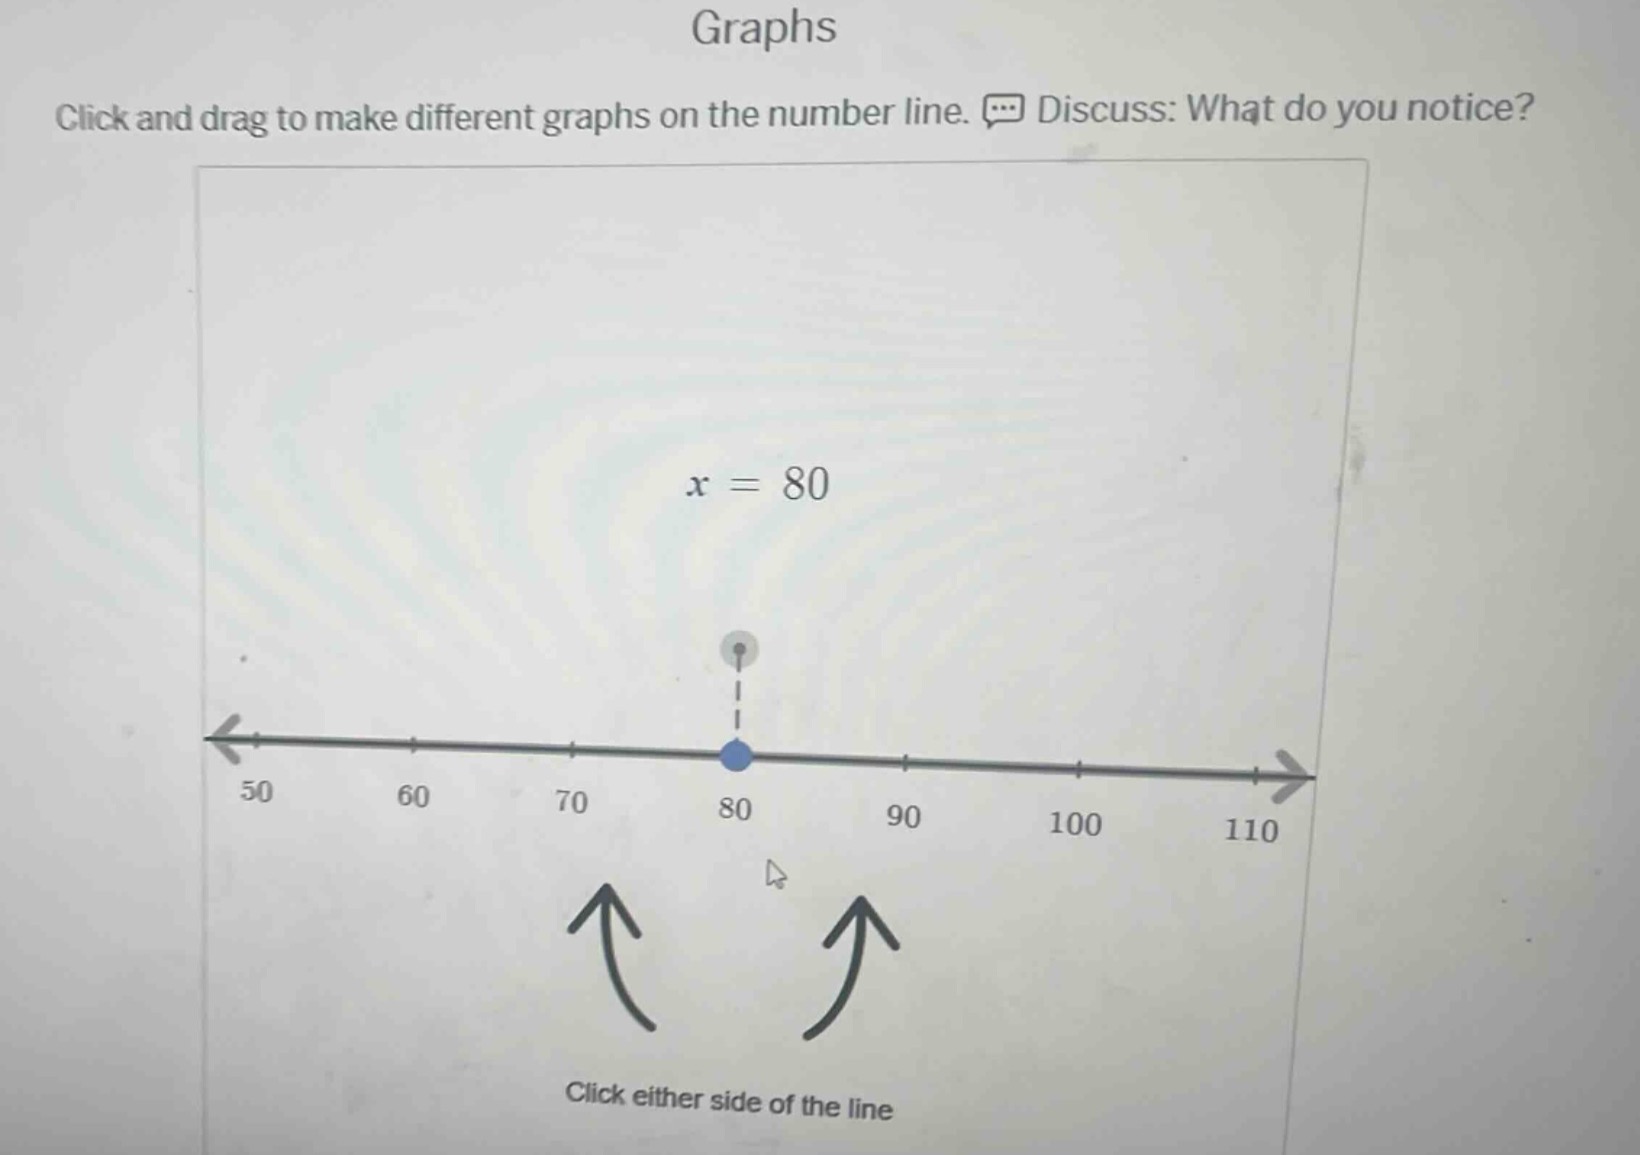
click and drag to make different graphs on the number line. discuss: what do you notice?
$x = 80$
click either side of the line
Step1: Analyze the graph
The graph shows a number line with a blue dot at \( x = 80 \), indicating the solution to the equation \( x = 80 \). When graphing a single - valued equation like \( x = a \) (where \( a = 80 \) here) on a number line, we represent it as a single point at the value of \( a \) on the number line.
Step2: Interpret the action
The instruction "Click and drag to make different graphs on the number line" and "Click either side of the line" suggests exploring how different inequalities or equations would be graphed. For example, if we consider an inequality like \( x>80 \), we would shade to the right of 80 on the number line, and for \( x < 80 \), we would shade to the left. But for the equation \( x = 80 \), it's a single point.

Snap & solve any problem in the app
Get step-by-step solutions on Sovi AI
Photo-based solutions with guided steps
Explore more problems and detailed explanations
The graph of \( x = 80 \) on the number line is a single blue dot (or point) at the position corresponding to 80 on the number line. When exploring different graphs (like for inequalities), clicking and dragging or clicking on either side would be used to shade regions: for \( x>80 \), shade to the right of 80; for \( x < 80 \), shade to the left of 80.