QUESTION IMAGE
Question
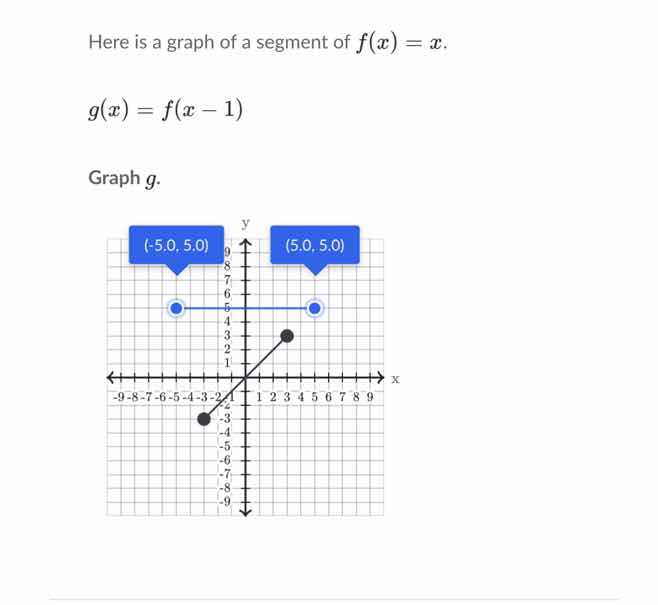
here is a graph of a segment of $f(x) = x$.
$g(x) = f(x - 1)$
graph $g$.
Step1: Understand the transformation
The function \( g(x) = f(x - 1) \) represents a horizontal shift of the function \( f(x) \). For a function \( y = f(x - h) \), if \( h>0 \), the graph of \( f(x) \) is shifted \( h \) units to the right. Here, \( h = 1 \), so we shift the graph of \( f(x)=x \) 1 unit to the right.
Step2: Identify key points of \( f(x) \)
Looking at the graph of \( f(x)=x \), we can see two points (assuming the line segment for \( f(x) \) has these points, but from the given graph, the line \( f(x)=x \) has points, for example, let's consider the two black dots. Wait, actually, the blue line is a horizontal line (maybe a different function, but the line \( f(x)=x \) has a slope of 1. Let's take the two points on \( f(x) = x \): let's say the lower black dot is at \( (-2, -2) \) (since \( f(-2)=-2 \)) and the upper black dot is at \( (3, 3) \) (since \( f(3)=3 \)).
Step3: Apply the shift
To shift these points 1 unit to the right, we add 1 to the x - coordinate of each point. For the point \( (-2, -2) \), shifting right 1 unit gives \( (-2 + 1, -2)=(-1, -2) \). For the point \( (3, 3) \), shifting right 1 unit gives \( (3 + 1, 3)=(4, 3) \).
Step4: Graph the new function
The function \( g(x)=f(x - 1)=x - 1 \) (since \( f(x)=x \), so \( f(x - 1)=x - 1 \)) is a straight line with slope 1 and y - intercept - 1. We can plot the shifted points and draw the line segment. The domain of the original segment of \( f(x) \) (from the graph, looking at the x - values of the segment of \( f(x) \)): if the original segment of \( f(x) \) is from \( x=-2 \) to \( x = 3 \) (based on the black dots), then the segment of \( g(x) \) will be from \( x=-2 + 1=-1 \) to \( x=3 + 1 = 4 \), with the corresponding y - values shifted as well.

Snap & solve any problem in the app
Get step-by-step solutions on Sovi AI
Photo-based solutions with guided steps
Explore more problems and detailed explanations
To graph \( g(x)=f(x - 1) \) (where \( f(x)=x \)):
- Recognize that \( g(x) \) is \( f(x) \) shifted 1 unit to the right.
- Take key points on \( f(x)=x \) (e.g., \( (-2,-2) \) and \( (3,3) \)) and shift them 1 unit right to get \( (-1,-2) \) and \( (4,3) \).
- Draw a line segment between these shifted points (and any other points on the segment of \( f(x) \) shifted right) with slope 1, representing \( g(x)=x - 1 \) over the appropriate domain (shifted 1 unit right from the domain of \( f(x) \)'s segment).
(Note: If we consider the blue horizontal line, but that seems to be a different function. The main transformation for \( g(x)=f(x - 1) \) where \( f(x)=x \) is a horizontal shift right by 1 unit.)
The graph of \( g(x) \) is the graph of \( f(x)=x \) shifted 1 unit to the right. So we plot the line \( y=x - 1 \) for the same range of x - values as the segment of \( f(x) \) (shifted right by 1) and draw the line segment.