QUESTION IMAGE
Question
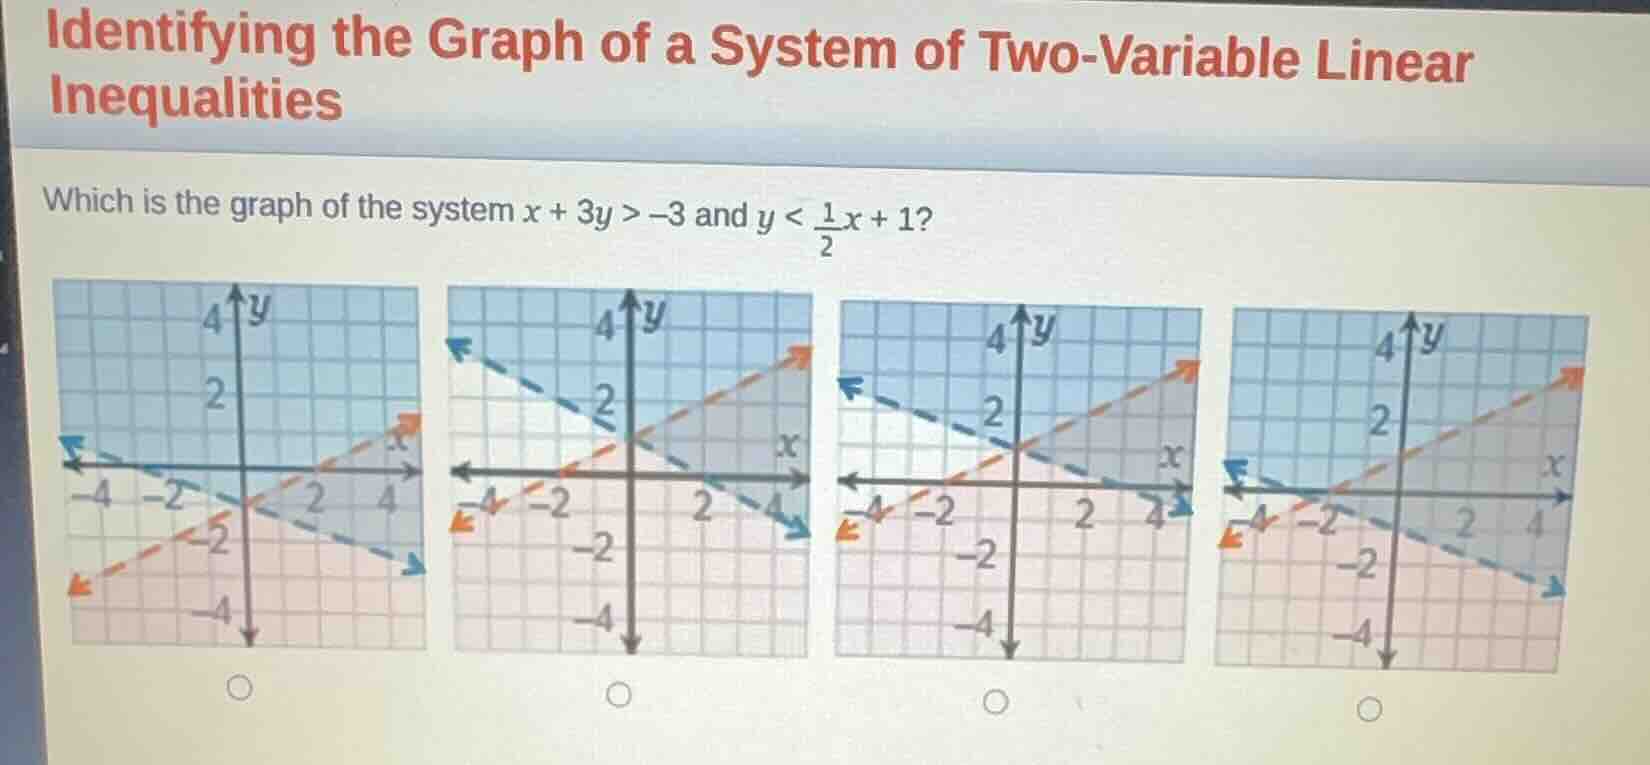
identifying the graph of a system of two-variable linear inequalities
which is the graph of the system $x + 3y > -3$ and $y < \frac{1}{2}x + 1$?
four graphs with coordinate planes and lines, each with a circle below for selection
Step1: Analyze the first inequality \(x + 3y > -3\)
Rewrite it in slope - intercept form (\(y=mx + b\)):
Subtract \(x\) from both sides: \(3y>-x - 3\)
Divide both sides by 3: \(y>-\frac{1}{3}x - 1\)
The boundary line is \(y = -\frac{1}{3}x-1\) (dashed line because the inequality is \(>\), not \(\geq\)). To find the region, we can test a point, for example, \((0,0)\). Plugging into \(x + 3y\): \(0+3\times0=0>-3\), so the region containing \((0,0)\) is part of the solution for \(x + 3y>-3\).
Step2: Analyze the second inequality \(y<\frac{1}{2}x + 1\)
The boundary line is \(y=\frac{1}{2}x + 1\) (dashed line because the inequality is \(<\), not \(\leq\)). Testing the point \((0,0)\): \(0<\frac{1}{2}\times0 + 1=1\), so the region containing \((0,0)\) is part of the solution for \(y<\frac{1}{2}x + 1\).
Step3: Analyze the boundary lines and regions
- For \(y>-\frac{1}{3}x - 1\), the slope of the boundary line is \(-\frac{1}{3}\) and the y - intercept is \(-1\).
- For \(y<\frac{1}{2}x + 1\), the slope of the boundary line is \(\frac{1}{2}\) and the y - intercept is \(1\).
Now, let's analyze the graphs:
- The first graph: Check the boundary lines and regions. The dashed line with slope \(-\frac{1}{3}\) (from \(x + 3y>-3\)) and the dashed line with slope \(\frac{1}{2}\) (from \(y<\frac{1}{2}x + 1\)) and the intersection of the regions. The region that satisfies both inequalities (the overlapping region) should be checked.
- The second graph: Incorrect region for one of the inequalities.
- The third graph: Incorrect region for one of the inequalities.
- The fourth graph: The boundary lines have the correct slopes and y - intercepts, and the overlapping region (the region that is above \(y = -\frac{1}{3}x-1\) and below \(y=\frac{1}{2}x + 1\)) matches the solution of the system.

Snap & solve any problem in the app
Get step-by-step solutions on Sovi AI
Photo-based solutions with guided steps
Explore more problems and detailed explanations
The fourth graph (the last one among the four given graphs)