QUESTION IMAGE
Question
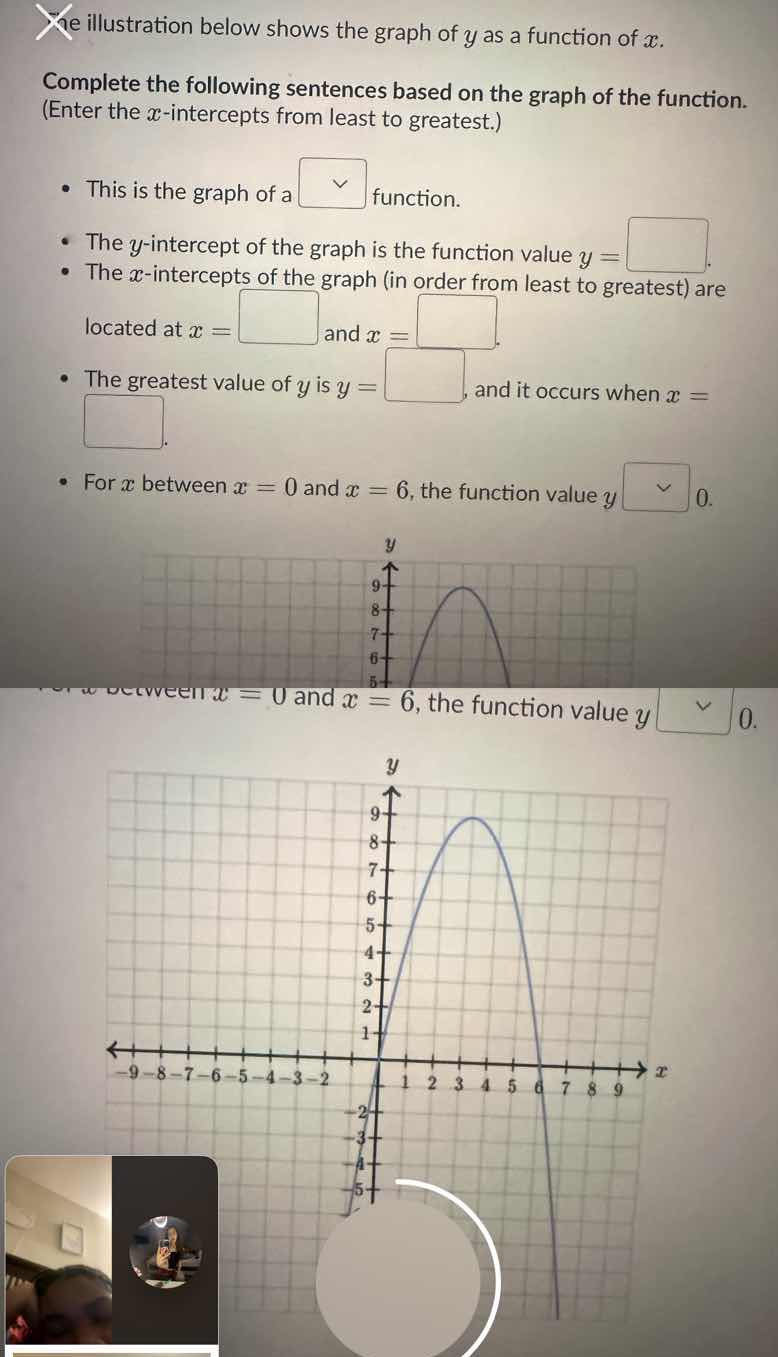
the illustration below shows the graph of ( y ) as a function of ( x ).
complete the following sentences based on the graph of the function.
(enter the ( x )-intercepts from least to greatest.)
- this is the graph of a (\boldsymbol{downarrow}) function.
- the ( y )-intercept of the graph is the function value ( y = \boldsymbol{square} ).
- the ( x )-intercepts of the graph (in order from least to greatest) are located at ( x = \boldsymbol{square} ) and ( x = \boldsymbol{square} ).
- the greatest value of ( y ) is ( y = \boldsymbol{square} ), and it occurs when ( x = \boldsymbol{square} ).
- for ( x ) between ( x = 0 ) and ( x = 6 ), the function value ( y \boldsymbol{downarrow} 0 ).
Step1: Identify function type
The graph is a downward-opening parabola, which is a quadratic function.
Step2: Find y-intercept
The y-intercept is where $x=0$. From the graph, at $x=0$, $y=1$.
Step3: Find x-intercepts
x-intercepts are where $y=0$. From the graph, these are at $x=0$ and $x=6$ (ordered least to greatest).
Step4: Find maximum y-value
The vertex (highest point) of the parabola has $y=9$, occurring at $x=3$.
Step5: Analyze y between x=0 and 6
For $0 < x < 6$, the graph is above the x-axis, so $y > 0$.

Snap & solve any problem in the app
Get step-by-step solutions on Sovi AI
Photo-based solutions with guided steps
Explore more problems and detailed explanations
- This is the graph of a quadratic function.
- The y-intercept of the graph is the function value $y = 1$.
- The x-intercepts of the graph (in order from least to greatest) are located at $x = 0$ and $x = 6$.
- The greatest value of $y$ is $y = 9$, and it occurs when $x = 3$.
- For $x$ between $x = 0$ and $x = 6$, the function value $y > 0$.