QUESTION IMAGE
Question
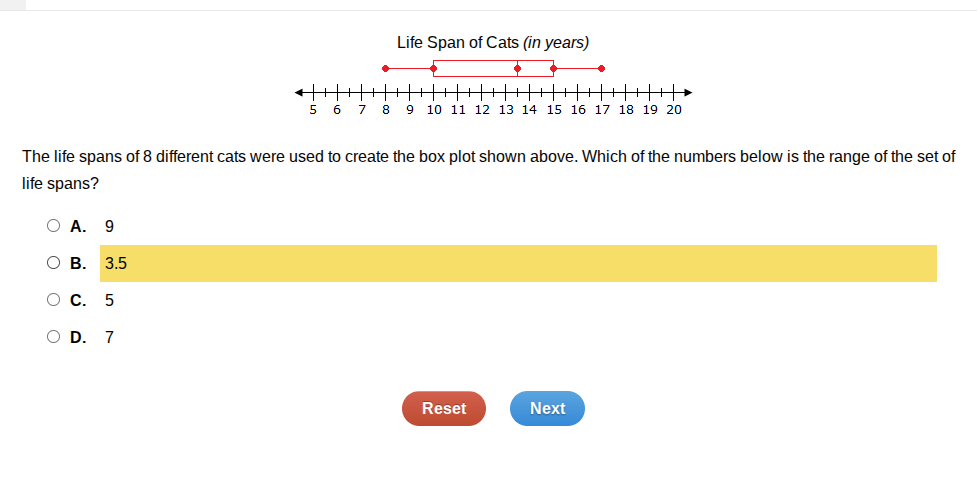
life span of cats (in years)
the life spans of 8 different cats were used to create the box plot shown above. which of the numbers below is the range of the set of life spans?
a. 9
b. 3.5
c. 5
d. 7
Step1: Recall the formula for range
The range of a data set is calculated as the difference between the maximum value and the minimum value, i.e., \( \text{Range} = \text{Maximum} - \text{Minimum} \).
Step2: Identify maximum and minimum from the box plot
From the box plot (Life Span of Cats), the minimum value (leftmost dot) is at 8, and the maximum value (rightmost dot) is at 17.
Step3: Calculate the range
Using the formula, \( \text{Range} = 17 - 8 = 9 \).

Snap & solve any problem in the app
Get step-by-step solutions on Sovi AI
Photo-based solutions with guided steps
Explore more problems and detailed explanations
A. 9