QUESTION IMAGE
Question
making an inference
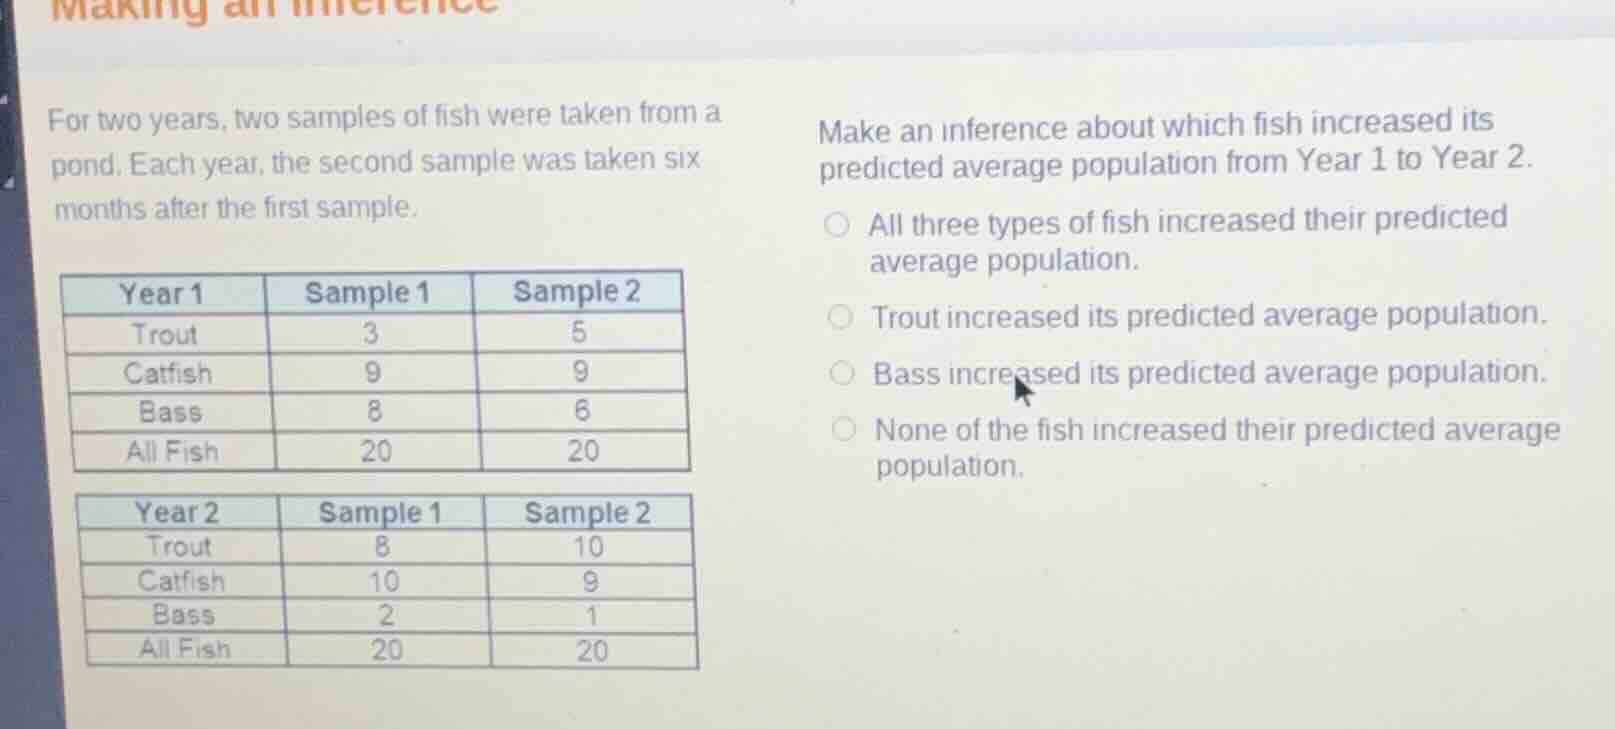
for two years, two samples of fish were taken from a pond. each year, the second sample was taken six months after the first sample.
| year 1 | sample 1 | sample 2 |
|---|---|---|
| catfish | 9 | 9 |
| bass | 8 | 6 |
| all fish | 20 | 20 |
| year 2 | sample 1 | sample 2 |
|---|---|---|
| catfish | 10 | 9 |
| bass | 2 | 1 |
| all fish | 20 | 20 |
make an inference about which fish increased its predicted average population from year 1 to year 2.
- all three types of fish increased their predicted average population.
- trout increased its predicted average population.
- bass increased its predicted average population.
- none of the fish increased their predicted average population.
Step1: Calculate Year1 avg per fish
Trout: $\frac{3+5}{2}=4$; Catfish: $\frac{9+9}{2}=9$; Bass: $\frac{8+6}{2}=7$
Step2: Calculate Year2 avg per fish
Trout: $\frac{8+10}{2}=9$; Catfish: $\frac{10+9}{2}=9.5$; Bass: $\frac{2+1}{2}=1.5$
Step3: Compare year-over-year averages
Trout: $9>4$ (increase); Catfish: $9.5>9$ (increase); Bass: $1.5<7$ (decrease)
Step4: Match to options
Only trout's increase is listed as a standalone correct option among choices.

Snap & solve any problem in the app
Get step-by-step solutions on Sovi AI
Photo-based solutions with guided steps
Explore more problems and detailed explanations
Trout increased its predicted average population.