QUESTION IMAGE
Question
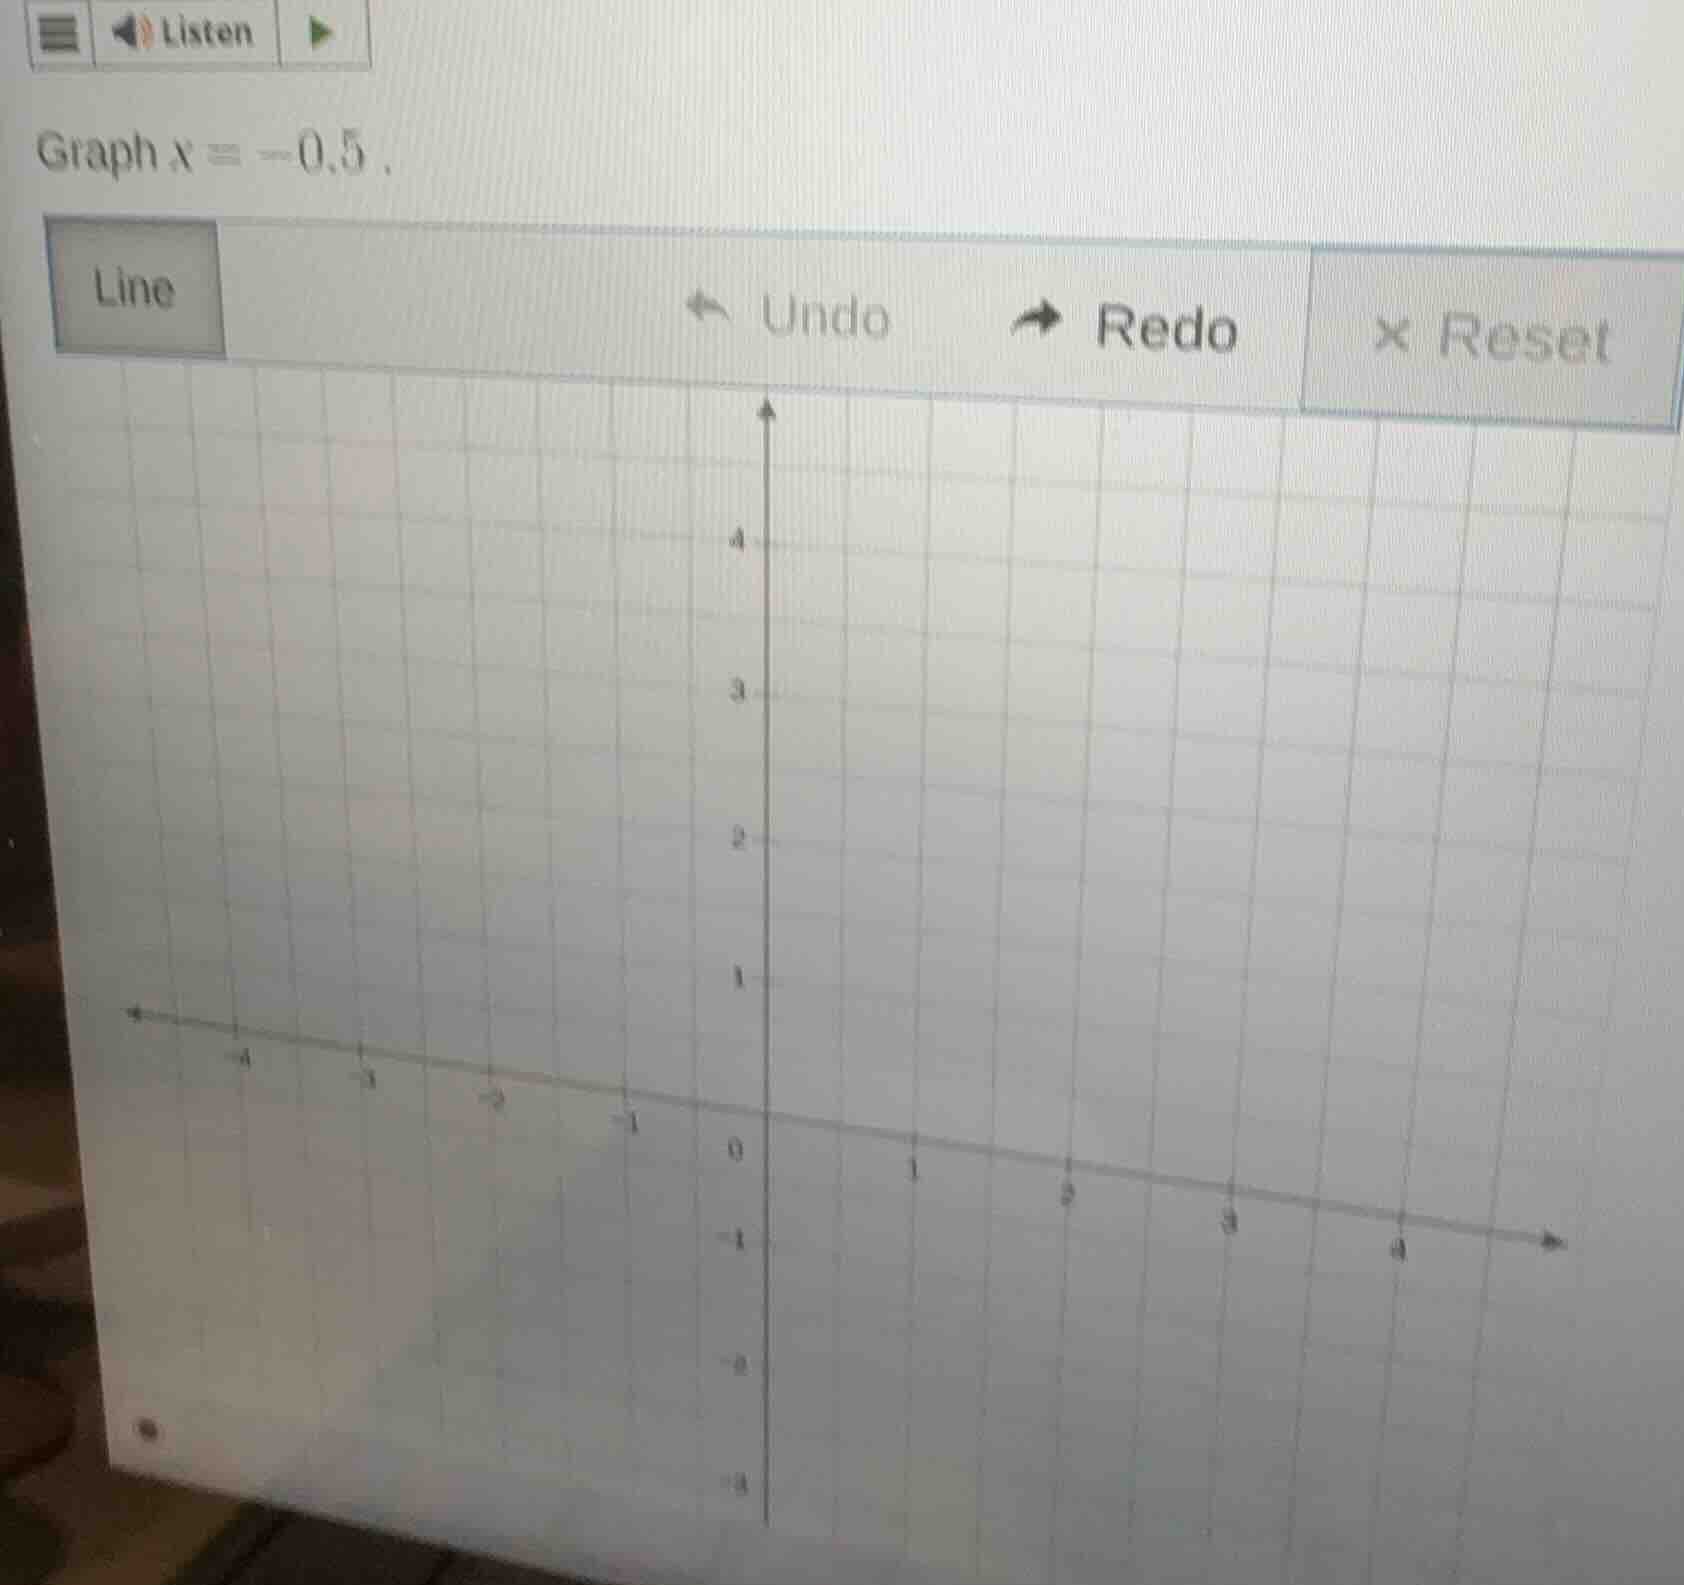
graph $x = -0.5$.
Step1: Understand the equation type
The equation \( x = -0.5 \) is a vertical line. For any vertical line \( x = a \), the \( x \)-coordinate of all points on the line is \( a \), and the \( y \)-coordinate can be any real number.
Step2: Locate \( x = -0.5 \) on the x - axis
On the given coordinate grid, the x - axis has markings. - 0.5 is halfway between - 1 and 0. We need to draw a vertical line passing through the point where \( x=-0.5 \) (and \( y \) can be any value, e.g., we can use two points like \( (-0.5, 0) \) and \( (-0.5, 4) \) or any other \( y \)-values) to represent the line \( x = - 0.5 \).
(Note: Since this is a graphing problem, the final answer is the vertical line drawn at \( x=-0.5 \) on the coordinate grid. If we were to describe the key points, the line passes through \( x=-0.5 \) for all \( y \)-values. )

Snap & solve any problem in the app
Get step-by-step solutions on Sovi AI
Photo-based solutions with guided steps
Explore more problems and detailed explanations
The graph of \( x = - 0.5 \) is a vertical line passing through the point \( (-0.5,y) \) for all real - valued \( y \). On the given grid, it is a vertical line halfway between \( x = - 1 \) and \( x = 0 \), extending infinitely in the positive and negative \( y \)-directions.