QUESTION IMAGE
Question
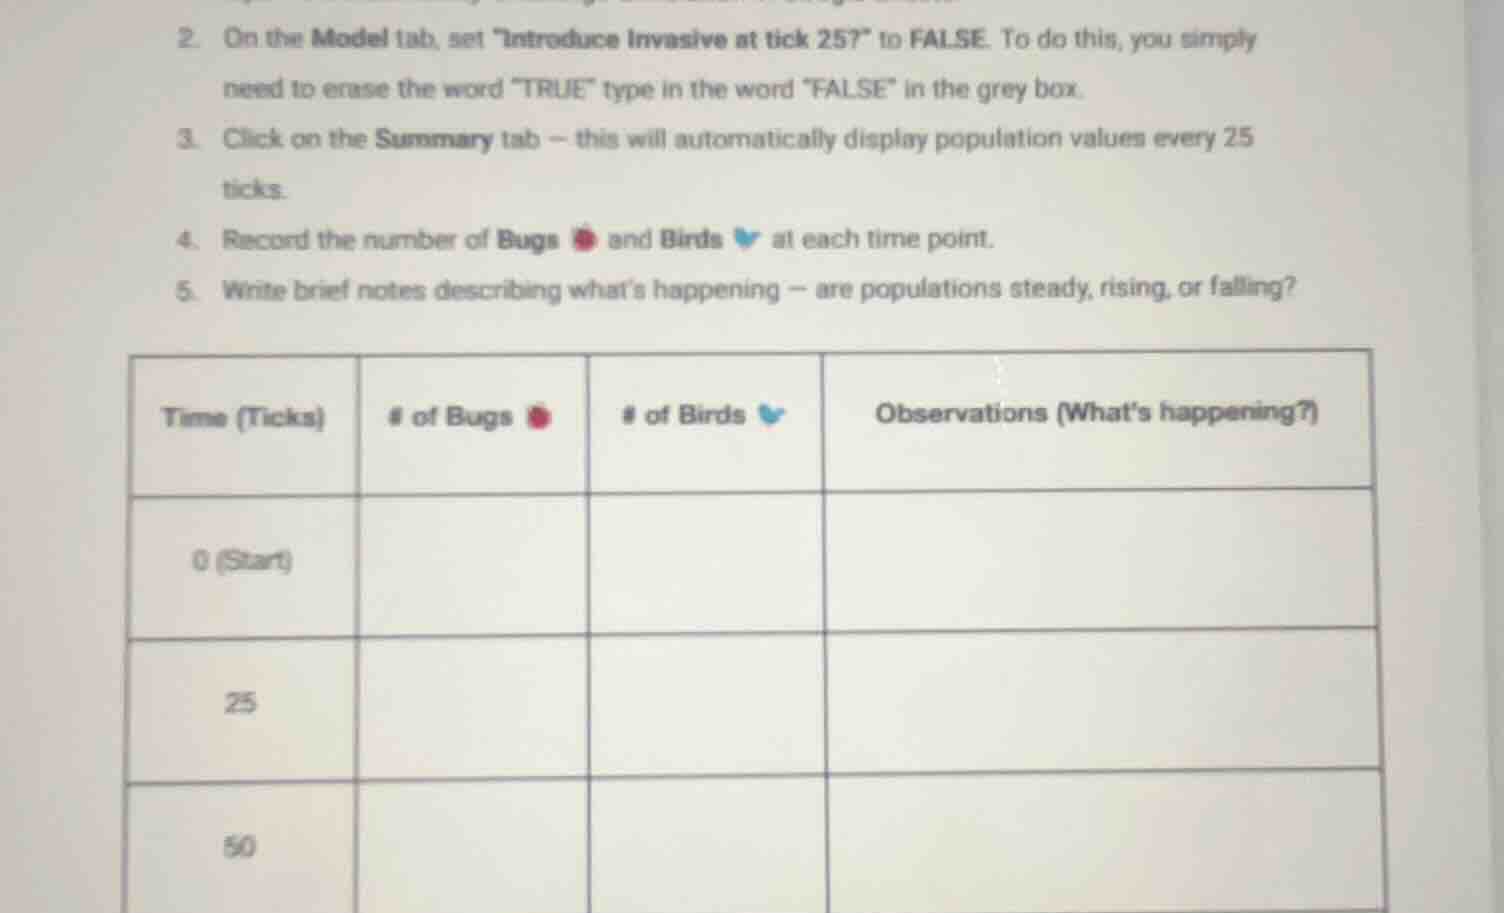
- on the model tab, set \introduce invasive at tick 25?\ to false. to do this, you simply need to erase the word \true\ type in the word \false\ in the grey box.
- click on the summary tab – this will automatically display population values every 25 ticks.
- record the number of bugs ⚫ and birds ➤ at each time point.
- write brief notes describing what’s happening – are populations steady, rising, or falling?
| time (ticks) | # of bugs ⚫ | # of birds ➤ | observations (whats happening?) |
|---|---|---|---|
| 25 | |||
| 50 |
This appears to be a lab activity related to simulating population dynamics (of bugs and birds) over time. Since there's no specific question here (like analyzing the data, predicting trends, etc.), but if we assume a question like "What is the purpose of this activity?" or "How to analyze the data?", here's a brief explanation for a possible question:
The activity is likely designed to study predator - prey dynamics (bugs as prey, birds as predators) by observing how their populations change over time (at 0, 25, 50 ticks etc.). By recording the number of bugs and birds and making observations about population trends (steady, rising, falling), one can understand the interactions between the two species, such as how an increase in prey affects the predator population and vice - versa.

Snap & solve any problem in the app
Get step-by-step solutions on Sovi AI
Photo-based solutions with guided steps
Explore more problems and detailed explanations
The activity aims to study predator - prey population dynamics by observing and recording bug and bird populations over time and analyzing their trends.