QUESTION IMAGE
Question
name
hw3
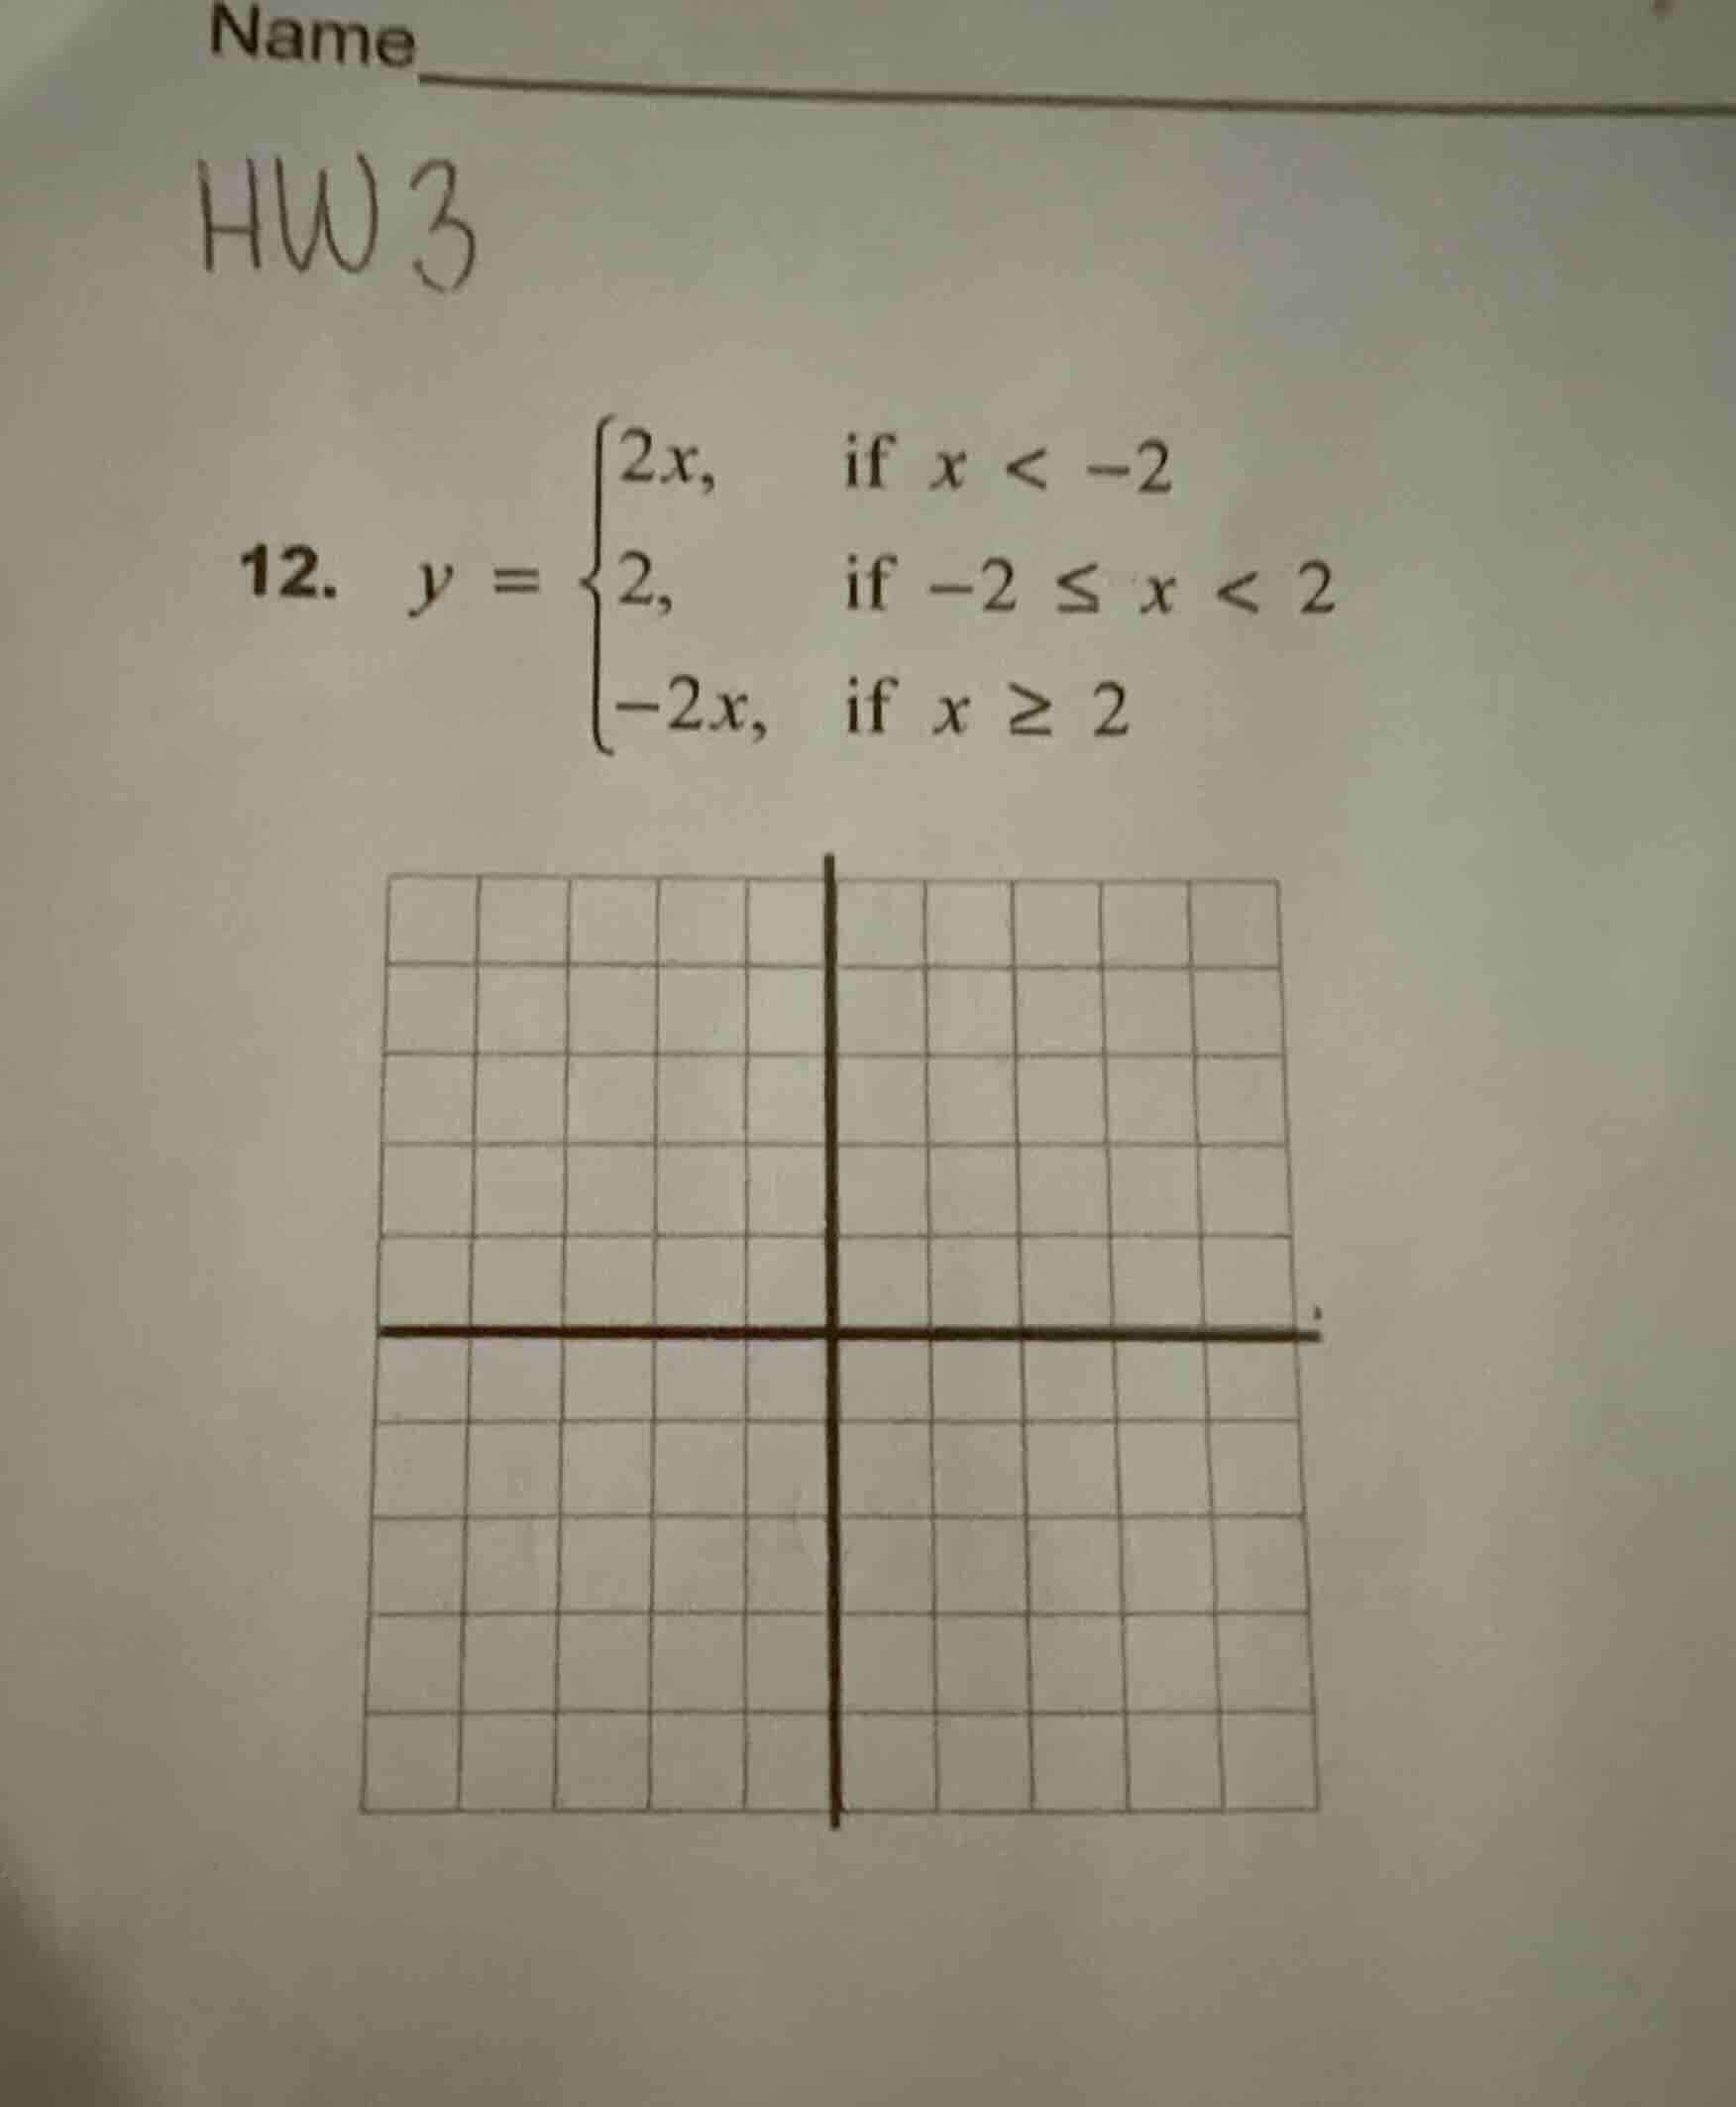
- $y = \
$
Step1: Analyze the first piece
For \( y = 2x \) when \( x < -2 \), this is a linear function with slope 2. Let's find some points: when \( x=-3 \), \( y = 2\times(-3)= -6 \); when \( x = -2 \), but \( x < -2 \) so we don't include \( x=-2 \) here, but we can see the limit as \( x \) approaches -2 from the left is \( 2\times(-2)= -4 \).
Step2: Analyze the second piece
For \( y = 2 \) when \( -2\leq x < 2 \), this is a horizontal line. At \( x=-2 \), \( y = 2 \) (closed dot), and at \( x = 2 \), \( y = 2 \) (open dot).
Step3: Analyze the third piece
For \( y=-2x \) when \( x\geq2 \), this is a linear function with slope -2. When \( x = 2 \), \( y=-2\times2=-4 \) (closed dot, since \( x\geq2 \) includes 2), when \( x = 3 \), \( y=-2\times3=-6 \).
Step4: Plot the points and draw the graph
- For the first part (\( x < -2 \)): Draw a line with slope 2, passing through points like (-3, -6), with an open dot at \( x=-2 \) (since \( x < -2 \)) with \( y=-4 \) (but we use the second piece at \( x=-2 \) which is \( y = 2 \), so the first piece approaches (-2, -4) from the left).
- For the second part (\( -2\leq x < 2 \)): Draw a horizontal line at \( y = 2 \), with a closed dot at (-2, 2) and an open dot at (2, 2).
- For the third part (\( x\geq2 \)): Draw a line with slope -2, passing through (2, -4) (closed dot) and (3, -6), etc.
The graph will have three parts: a line with positive slope on the left of \( x=-2 \), a horizontal line between \( x=-2 \) and \( x = 2 \), and a line with negative slope on the right of \( x = 2 \).

Snap & solve any problem in the app
Get step-by-step solutions on Sovi AI
Photo-based solutions with guided steps
Explore more problems and detailed explanations
The graph consists of three parts: a line \( y = 2x \) (for \( x < -2 \)), a horizontal line \( y = 2 \) (for \( -2\leq x < 2 \)), and a line \( y=-2x \) (for \( x\geq2 \)). The key features are the horizontal segment between \( x=-2 \) (inclusive) and \( x = 2 \) (exclusive), and the two linear segments on either side with slopes 2 (left) and -2 (right). To plot, use the points calculated and connect them appropriately with open/closed dots as per the domain restrictions.