QUESTION IMAGE
Question
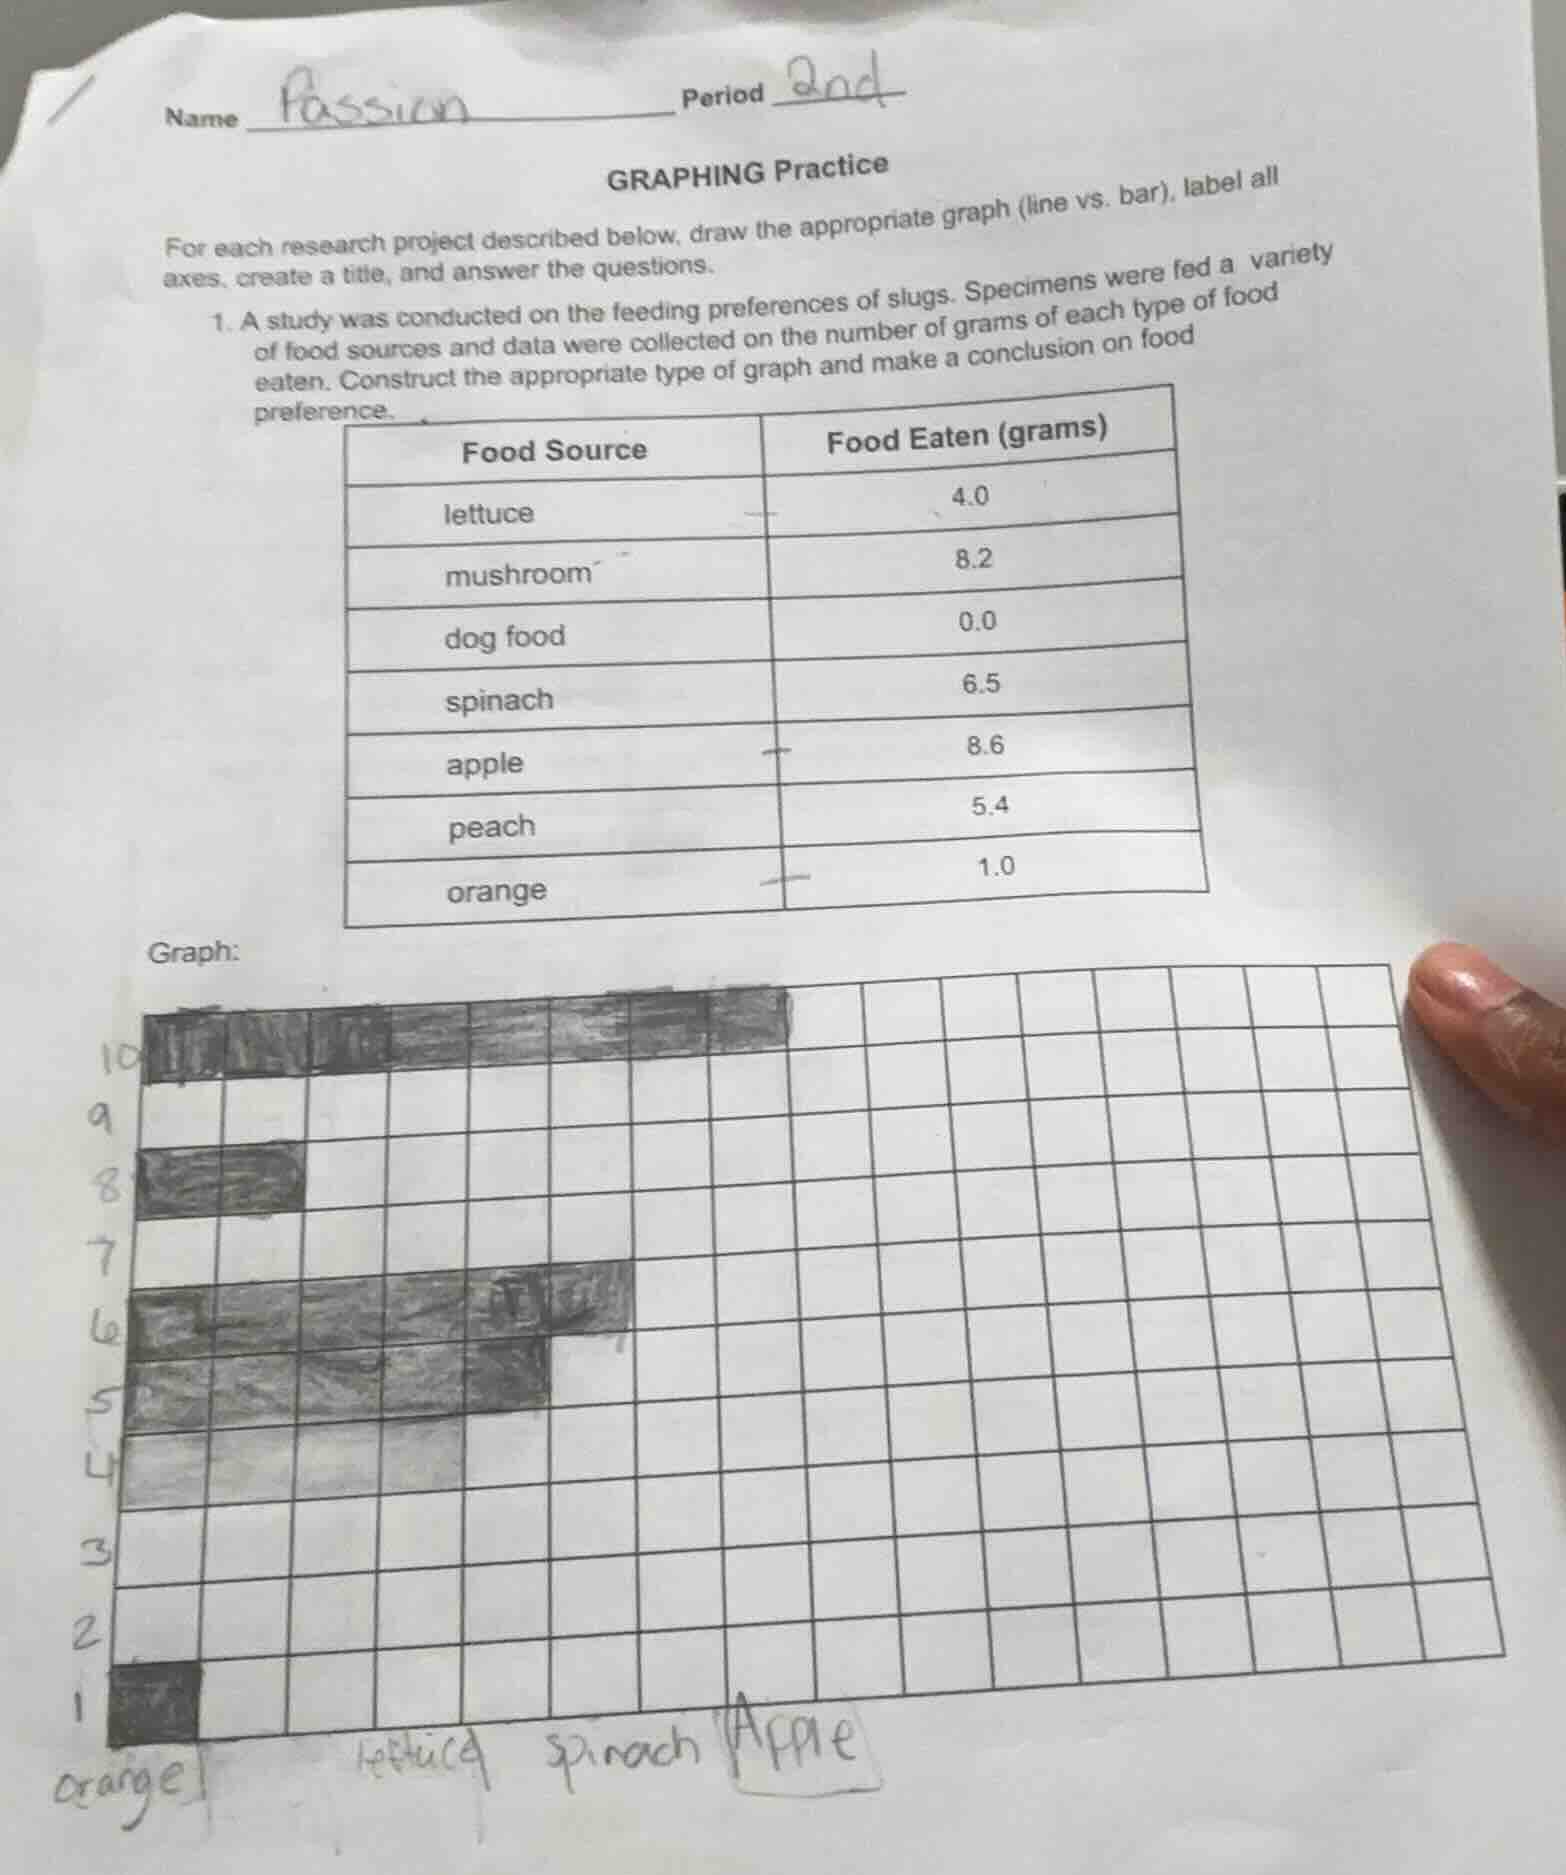
name passion period 2nd graphing practice for each research project described below, draw the appropriate graph (line vs. bar), label all axes, create a title, and answer the questions. 1. a study was conducted on the feeding preferences of slugs. specimens were fed a variety of food sources and data were collected on the number of grams of each type of food eaten. construct the appropriate type of graph and make a conclusion on food preference. food source food eaten (grams) lettuce 4.0 mushroom 8.2 dog food 0.0 spinach 6.5 apple 8.6 peach 5.4 orange 1.0 graph: (grid with some drawn bars and labels orange, lettuce, spinach, apple)
Step1: Determine Graph Type
We have categorical data (food sources) and numerical data (grams eaten). A bar graph is appropriate for comparing categories.
Step2: Label Axes
- X - axis: Food Source (lettuce, mushroom, dog food, spinach, apple, peach, orange)
- Y - axis: Food Eaten (grams), with scale from 0 to 10 (since max value is 8.6)
Step3: Create Title
"Feeding Preferences of Slugs: Grams of Food Eaten"
Step4: Draw Bars
- Lettuce: bar to 4.0
- Mushroom: bar to 8.2
- Dog food: bar to 0.0
- Spinach: bar to 6.5
- Apple: bar to 8.6
- Peach: bar to 5.4
- Orange: bar to 1.0
Step5: Conclusion
Compare bar heights. Apple (8.6g) and mushroom (8.2g) have the highest bars, dog food (0.0g) the lowest. So slugs prefer apple and mushroom, avoid dog food.

Snap & solve any problem in the app
Get step-by-step solutions on Sovi AI
Photo-based solutions with guided steps
Explore more problems and detailed explanations
Appropriate graph: Bar graph (with labeled axes, title as above, and bars drawn to respective heights). Conclusion: Slugs prefer apple and mushroom (highest grams eaten) and avoid dog food (0 grams eaten).