QUESTION IMAGE
Question
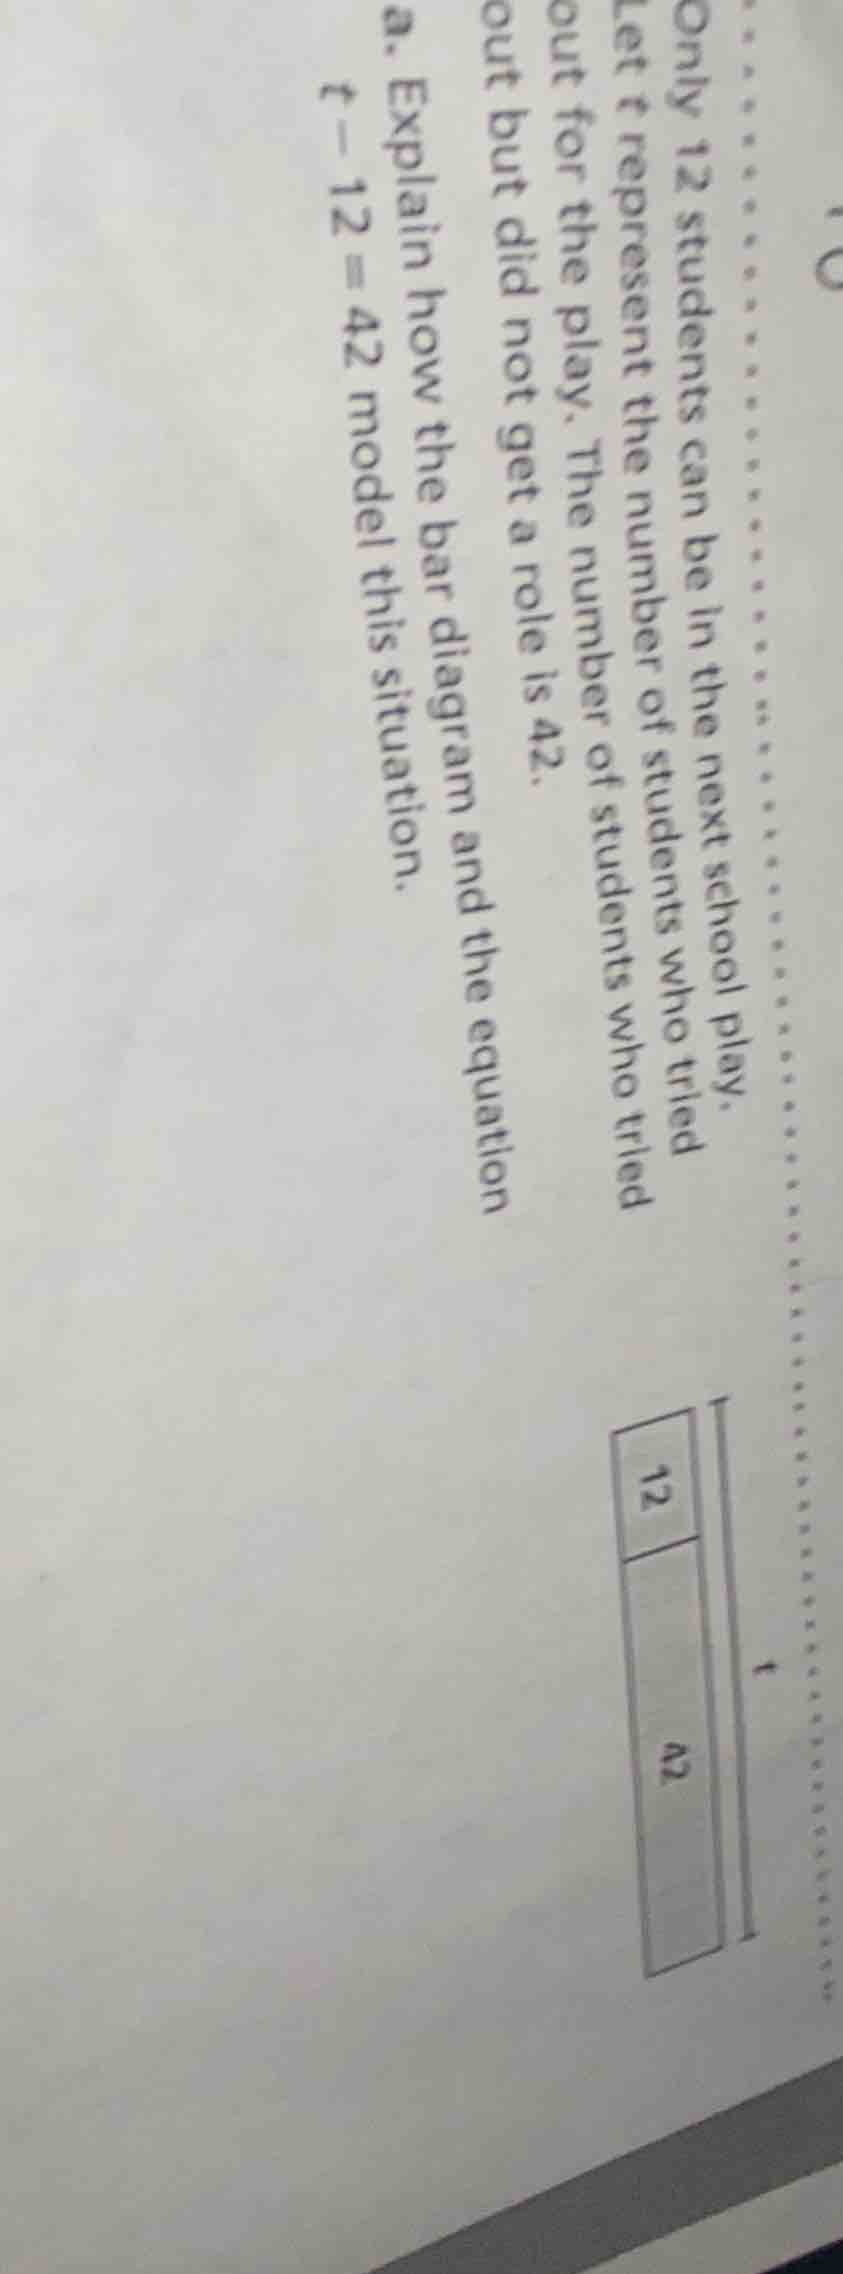
only 12 students can be in the next school play.
let $t$ represent the number of students who tried out for the play. the number of students who tried out but did not get a role is 42.
a. explain how the bar diagram and the equation $t - 12 = 42$ model this situation.
Step1: Define total students
Let $t$ = total students who tried out.
Step2: Relate parts to total
The full bar is $t$, split into 12 (got roles) and 42 (no roles). So total minus those who got roles equals those who did not:
$t - 12 = 42$
Step3: Explain bar diagram logic
The bar represents $t$, the entire group of students who tried out. The smaller segment labeled 12 is the students who got a role in the play, and the larger segment labeled 42 is the students who did not get a role. Subtracting the segment of students who got roles from the total gives the segment of students who did not get roles, which matches the equation.

Snap & solve any problem in the app
Get step-by-step solutions on Sovi AI
Photo-based solutions with guided steps
Explore more problems and detailed explanations
The bar diagram uses a full bar to represent $t$, the total number of students who tried out for the play. The bar is split into two parts: one segment labeled 12 for students who got a role, and another labeled 42 for students who did not. The equation $t - 12 = 42$ models this because if you take the total number of students who tried out ($t$) and subtract the 12 who got roles, you are left with the 42 students who did not get roles. Solving for $t$ gives $t = 42 + 12 = 54$, meaning 54 total students tried out.