QUESTION IMAGE
Question
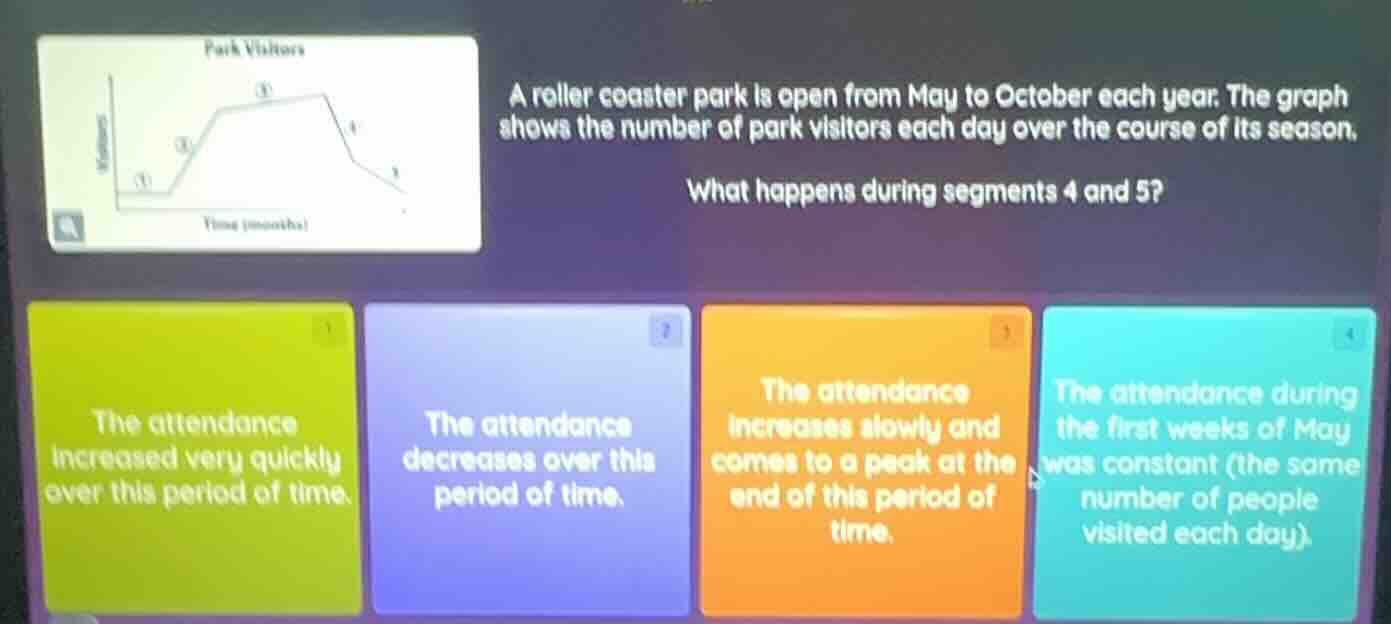
park visitors time (months) a roller coaster park is open from may to october each year. the graph shows the number of park visitors each day over the course of its season. what happens during segments 4 and 5? 1 the attendance increased very quickly over this period of time. 2 the attendance decreases over this period of time. 3 the attendance increases slowly and comes to a peak at the end of this period of time. 4 the attendance during the first weeks of may was constant (the same number of people visited each day).
Segments 4 and 5 of the park visitors graph (over time from May - October) likely represent the latter part of the season (e.g., late summer to fall). As the season progresses towards October, the number of visitors typically decreases as the weather cools or school/resumed routines reduce leisure time. Among the options, the purple - colored option ("The attendance decreases over this period of time") matches this trend for segments 4 and 5 (post - peak, as the park nears the end of its season). The green option is for a rapid increase (early season growth), orange for peaking, and blue for initial constant attendance (early May), so the purple option is correct.

Snap & solve any problem in the app
Get step-by-step solutions on Sovi AI
Photo-based solutions with guided steps
Explore more problems and detailed explanations
B. The attendance decreases over this period of time (assuming the purple option is labeled B; if the original labels differ, adjust the identifier to match the purple option's label with its text).