QUESTION IMAGE
Question
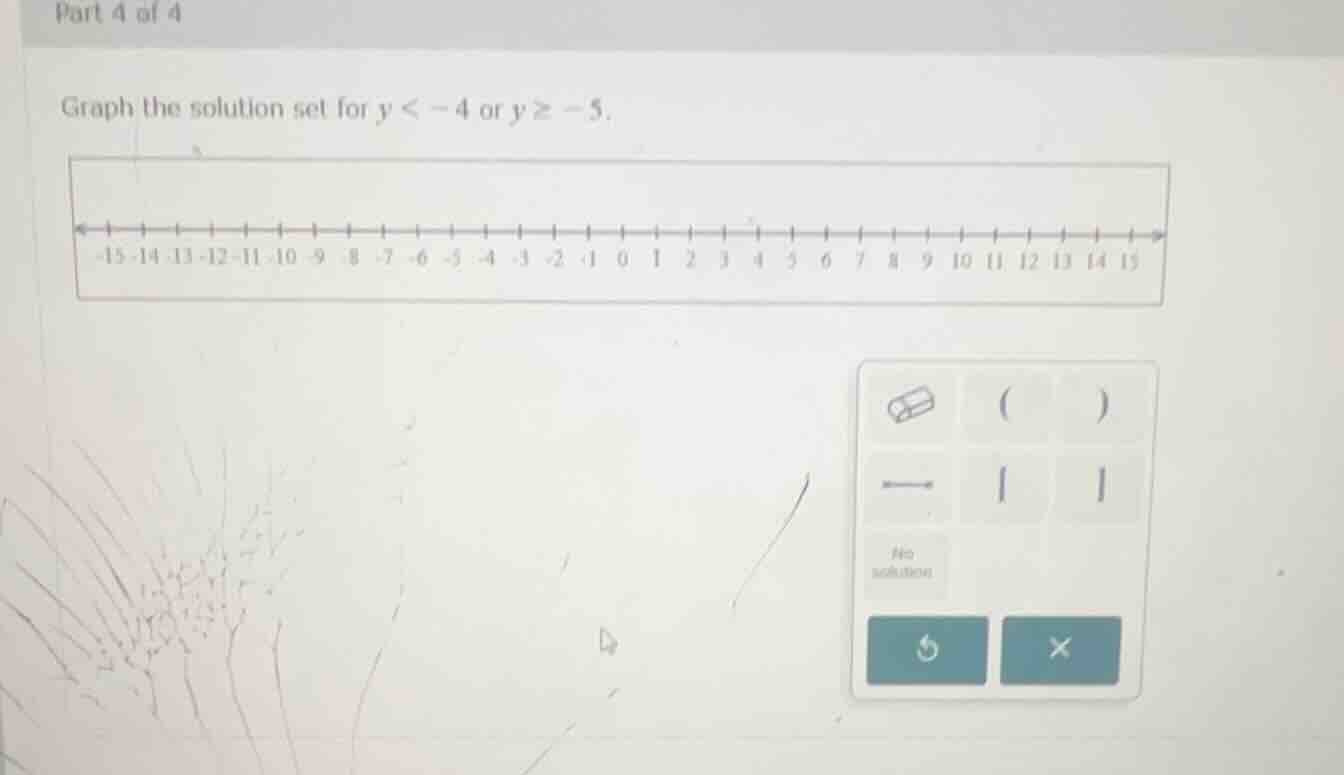
part 4 of 4
graph the solution set for ( y < -4 ) or ( y geq -5 ).
Step1: Analyze \( y < -4 \)
For the inequality \( y < -4 \), we use an open circle at \( -4 \) (since \( -4 \) is not included) and draw an arrow to the left (towards smaller numbers).
Step2: Analyze \( y \geq -5 \)
For the inequality \( y \geq -5 \), we use a closed circle at \( -5 \) (since \( -5 \) is included) and draw an arrow to the right (towards larger numbers).
Step3: Combine the two inequalities (OR)
Since we have "or", we combine the two solution sets. The solution set for \( y < -4 \) and \( y \geq -5 \) together covers all real numbers because every number is either less than \( -4 \) or greater than or equal to \( -5 \) (in fact, they overlap and cover the entire number line). So we draw a closed circle at \( -5 \), an open circle at \( -4 \), and the line connecting them (but since it's all real numbers, we can also think of it as the entire number line).

Snap & solve any problem in the app
Get step-by-step solutions on Sovi AI
Photo-based solutions with guided steps
Explore more problems and detailed explanations
The solution set is all real numbers. To graph it:
- Place a closed circle at \( -5 \) (for \( y \geq -5 \)).
- Place an open circle at \( -4 \) (for \( y < -4 \)).
- The arrows from \( -5 \) (closed) go right and from \( -4 \) (open) go left, and since they overlap, the entire number line is shaded (or marked) as the solution. In terms of the number line given, we can represent it by marking the closed circle at \( -5 \), open circle at \( -4 \), and the line connecting them (but effectively, all points on the number line are part of the solution).