QUESTION IMAGE
Question
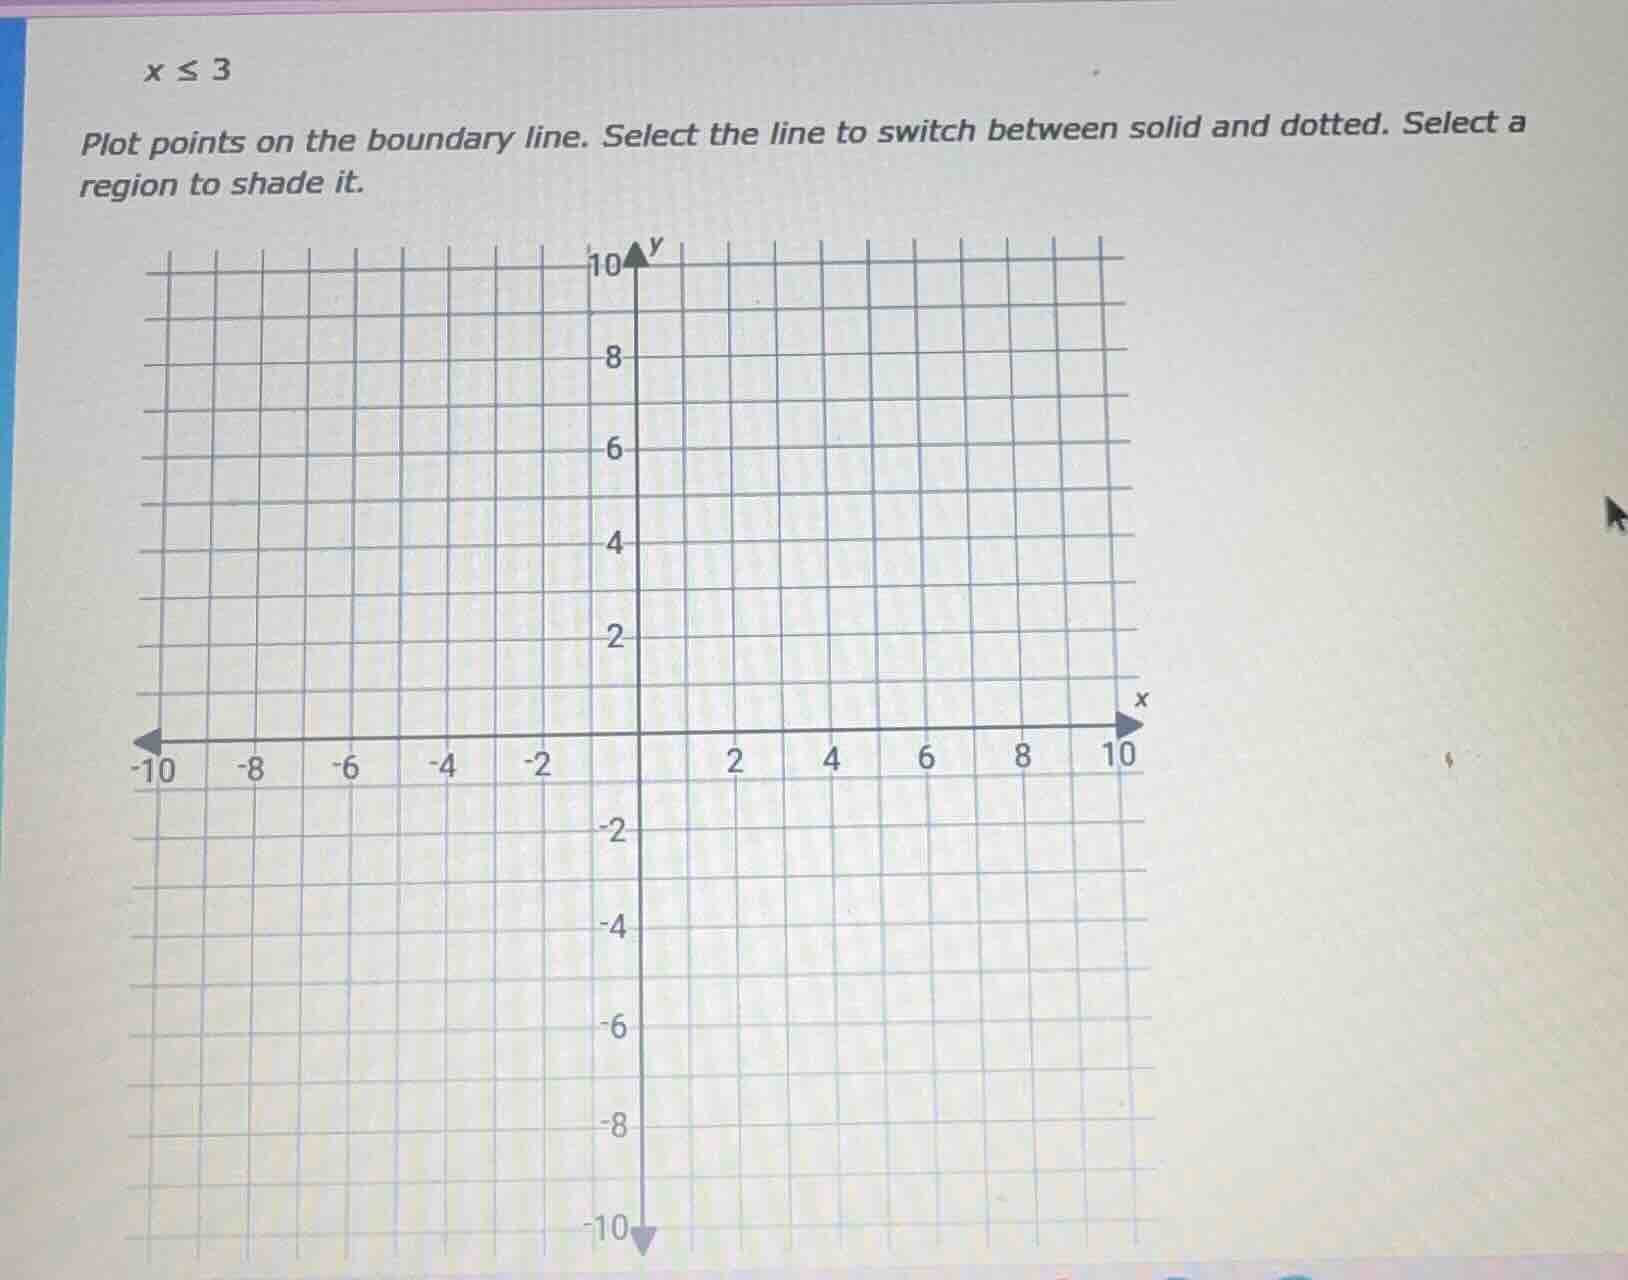
x ≤ 3
plot points on the boundary line. select the line to switch between solid and dotted. select a region to shade it.
Step1: Identify the boundary line
The inequality is \( x \leq 3 \). The boundary line is \( x = 3 \), which is a vertical line passing through \( x = 3 \) (all points where \( x = 3 \), regardless of \( y \)-value). Since the inequality is \( \leq \), the line should be solid (to include the boundary).
Step2: Plot the boundary line
On the coordinate grid, find \( x = 3 \) (the vertical line where the \( x \)-coordinate is 3). Plot points along this line, e.g., \( (3, 0) \), \( (3, 2) \), \( (3, -5) \), etc.
Step3: Determine the region to shade
For the inequality \( x \leq 3 \), we shade the region where \( x \)-values are less than or equal to 3. This is the region to the left of the line \( x = 3 \) (since as \( x \) decreases, we move left on the \( x \)-axis).

Snap & solve any problem in the app
Get step-by-step solutions on Sovi AI
Photo-based solutions with guided steps
Explore more problems and detailed explanations
- Boundary Line: Draw a solid vertical line at \( x = 3 \) (plot points like \( (3, y) \) for any \( y \), e.g., \( (3, 0) \), \( (3, 4) \), \( (3, -2) \)).
- Shaded Region: Shade the area to the left of the line \( x = 3 \) (all points with \( x \leq 3 \)).