QUESTION IMAGE
Question
practice & problem solving
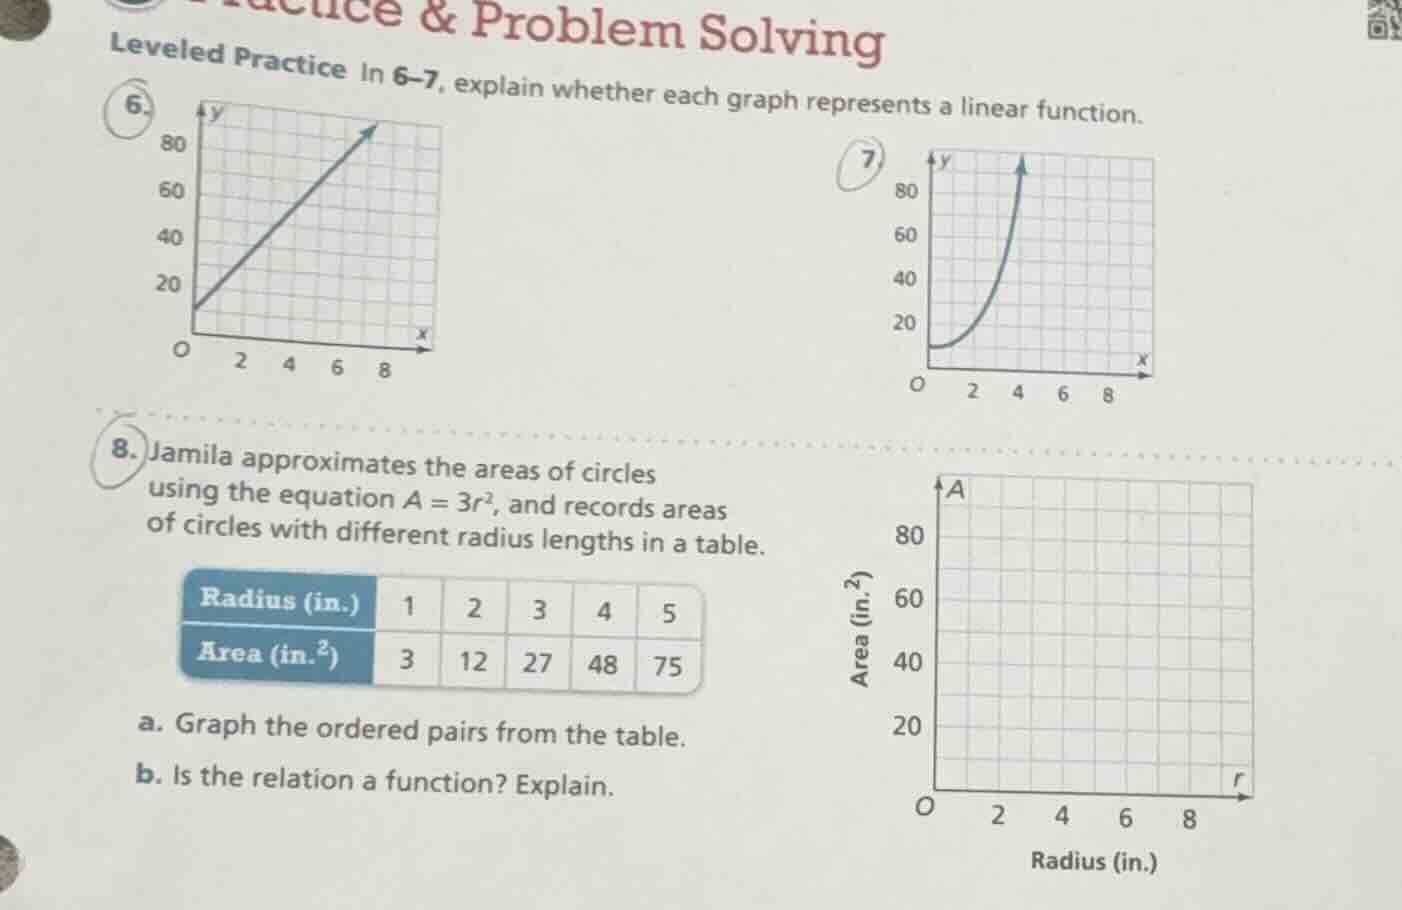
leveled practice in 6–7, explain whether each graph represents a linear function.
6.
7.
- jamila approximates the areas of circles
using the equation ( a = 3r^2 ), and records areas
of circles with different radius lengths in a table.
| radius (in.) | 1 | 2 | 3 | 4 | 5 |
|---|
a. graph the ordered pairs from the table.
b. is the relation a function? explain.
Question 6
Step1: Recall linear function definition
A linear function has a constant rate of change and its graph is a straight line.
Step2: Analyze the graph
The graph in question 6 is a straight line. It has a constant slope (rate of change) as it goes from the point (0, 20) and increases steadily. So, it satisfies the property of a linear function (graph is a straight line, constant rate of change).
Step1: Recall linear function definition
A linear function's graph is a straight line with a constant rate of change.
Step2: Analyze the graph
The graph in question 7 is a curve (not a straight line). Its slope (rate of change) is increasing, which means the rate of change is not constant. So, it does not satisfy the property of a linear function.
Step1: Identify ordered pairs
From the table, the radius \( r \) (x - value) and area \( A \) (y - value) give the ordered pairs: (1, 3), (2, 12), (3, 27), (4, 48), (5, 75).
Step2: Plot the points
- For (1, 3): Move 1 unit on the x - axis (radius) and 3 units on the y - axis (area) and mark the point.
- For (2, 12): Move 2 units on the x - axis and 12 units on the y - axis and mark the point.
- For (3, 27): Move 3 units on the x - axis and 27 units on the y - axis and mark the point.
- For (4, 48): Move 4 units on the x - axis and 48 units on the y - axis and mark the point.
- For (5, 75): Move 5 units on the x - axis and 75 units on the y - axis and mark the point.

Snap & solve any problem in the app
Get step-by-step solutions on Sovi AI
Photo-based solutions with guided steps
Explore more problems and detailed explanations
The graph in question 6 represents a linear function because its graph is a straight line (indicating a constant rate of change, a key property of linear functions).