QUESTION IMAGE
Question
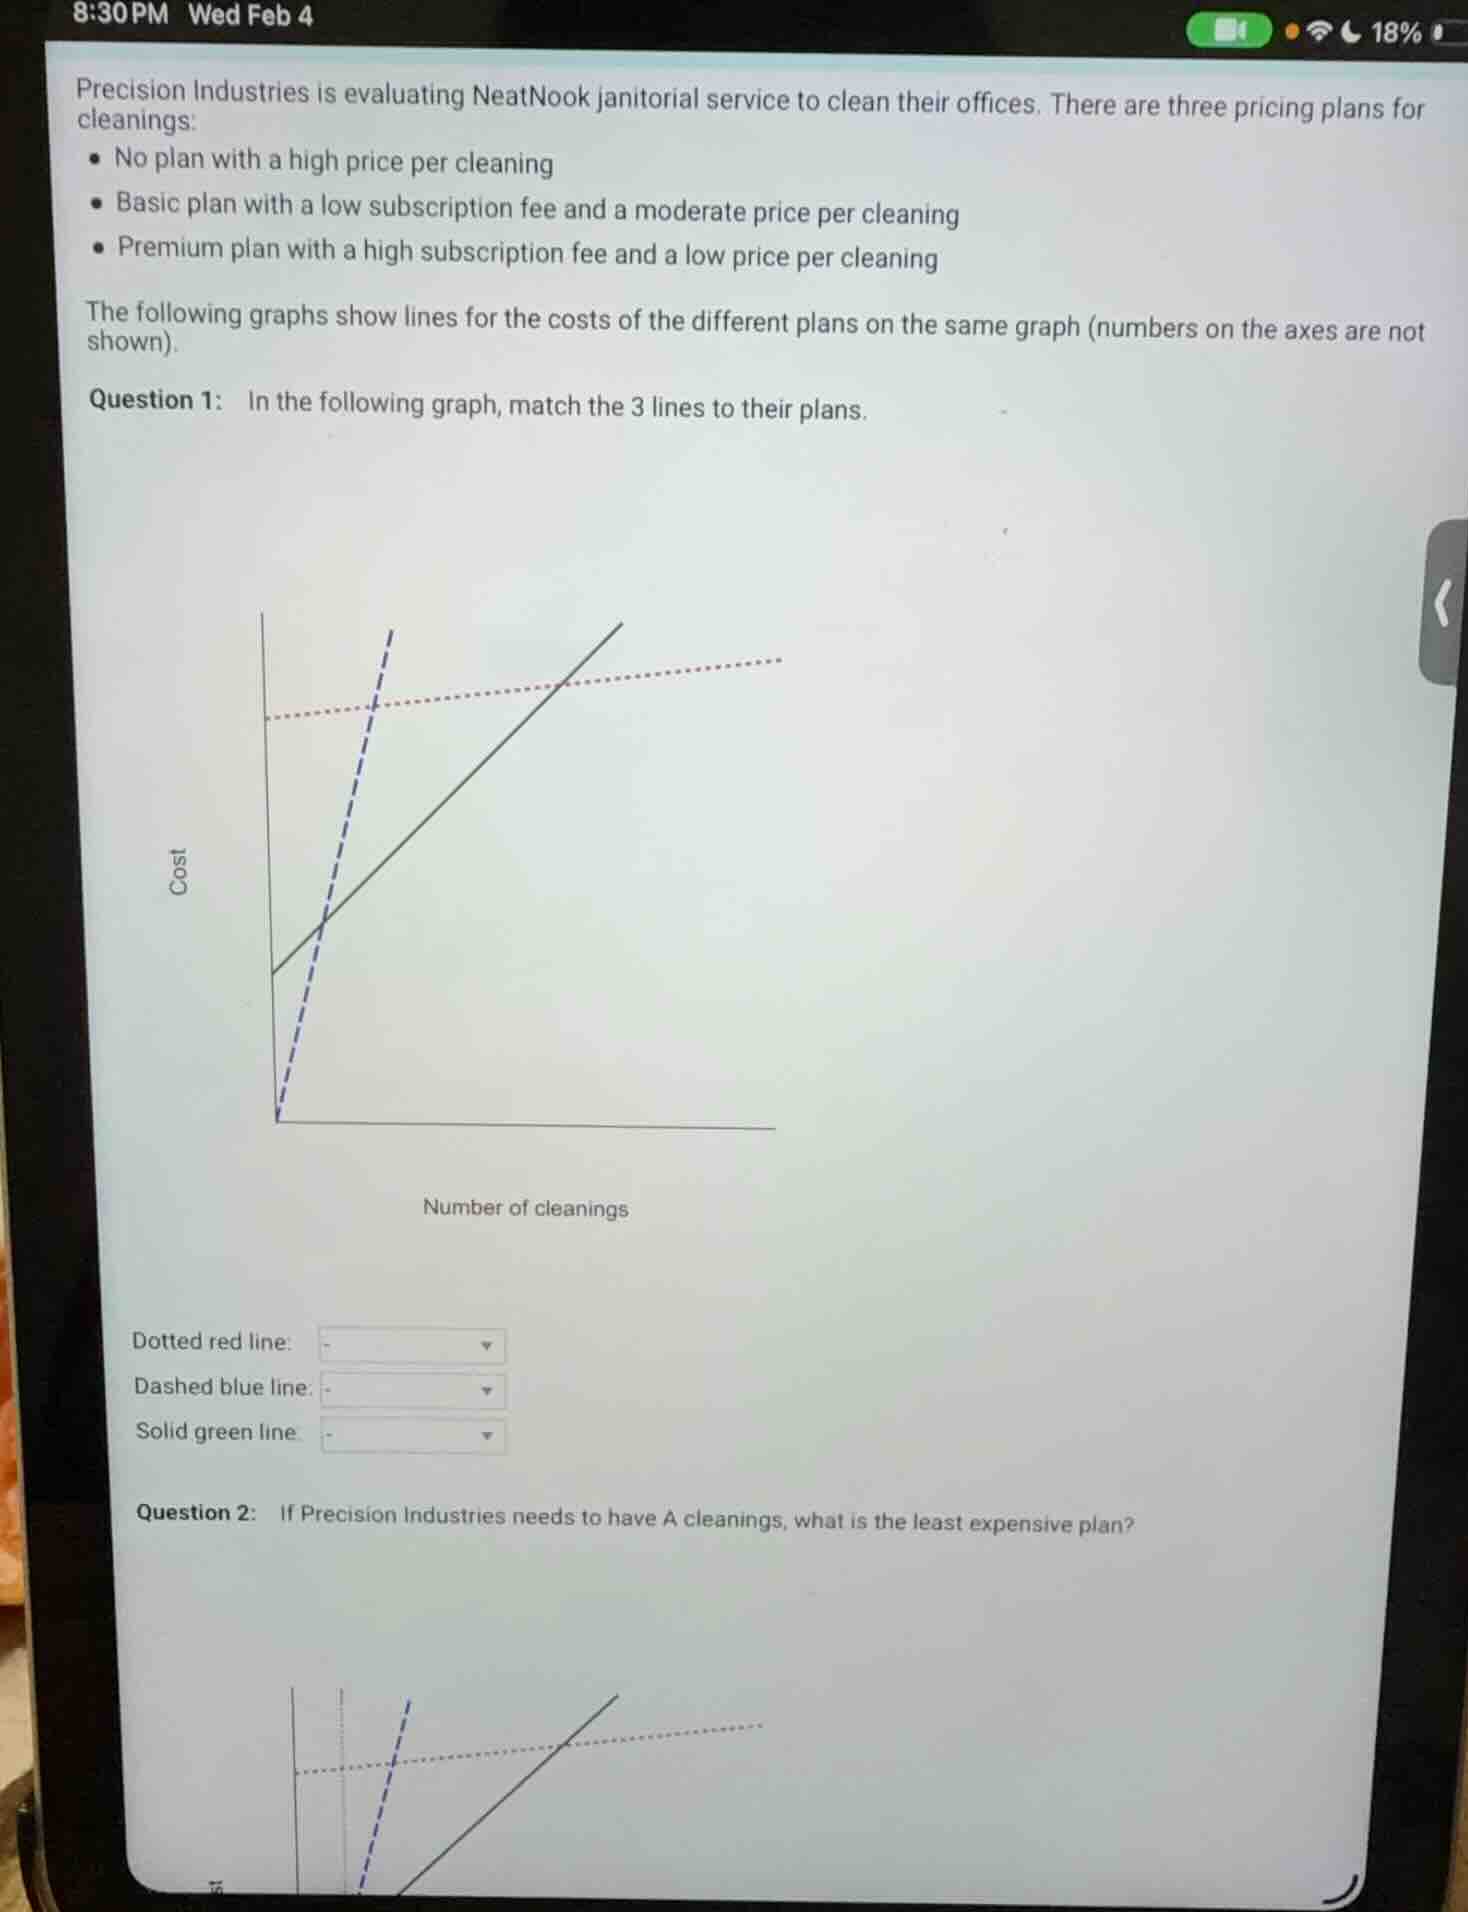
precision industries is evaluating neatnook janitorial service to clean their offices. there are three pricing plans for cleanings:
- no plan with a high price per cleaning
- basic plan with a low subscription fee and a moderate price per cleaning
- premium plan with a high subscription fee and a low price per cleaning
the following graphs show lines for the costs of the different plans on the same graph (numbers on the axes are not shown).
question 1: in the following graph, match the 3 lines to their plans.
graph with cost (y-axis) and number of cleanings (x-axis), with three lines: dotted red, dashed blue, solid green
dotted red line:
dashed blue line:
solid green line:
question 2: if precision industries needs to have a cleanings, what is the least expensive plan?
graph with cost (y-axis) and number of cleanings (x-axis), with three lines: dotted red, dashed blue, solid green, and a vertical line at a cleanings
Step1: Analyze fixed vs variable cost
Each plan's cost follows $C = F + vx$, where $F$ = fixed (subscription) fee, $v$ = price per cleaning, $x$ = number of cleanings.
Step2: Match dotted line to plan
Dotted line has constant cost ($v=0$, high $F$): matches Premium plan.
Step3: Match dashed line to plan
Dashed line has $F=0$, steep slope (high $v$): matches No plan.
Step4: Match solid line to plan
Solid line has low $F$, moderate slope (moderate $v$): matches Basic plan.
Step5: Evaluate cost at $x=4$
At 4 cleanings, dotted (Premium) line is lowest.

Snap & solve any problem in the app
Get step-by-step solutions on Sovi AI
Photo-based solutions with guided steps
Explore more problems and detailed explanations
Question 1:
- Dotted red line: Premium plan with a high subscription fee and a low price per cleaning
- Dashed blue line: No plan with a high price per cleaning
- Solid green line: Basic plan with a low subscription fee and a moderate price per cleaning
Question 2:
Premium plan with a high subscription fee and a low price per cleaning