QUESTION IMAGE
Question
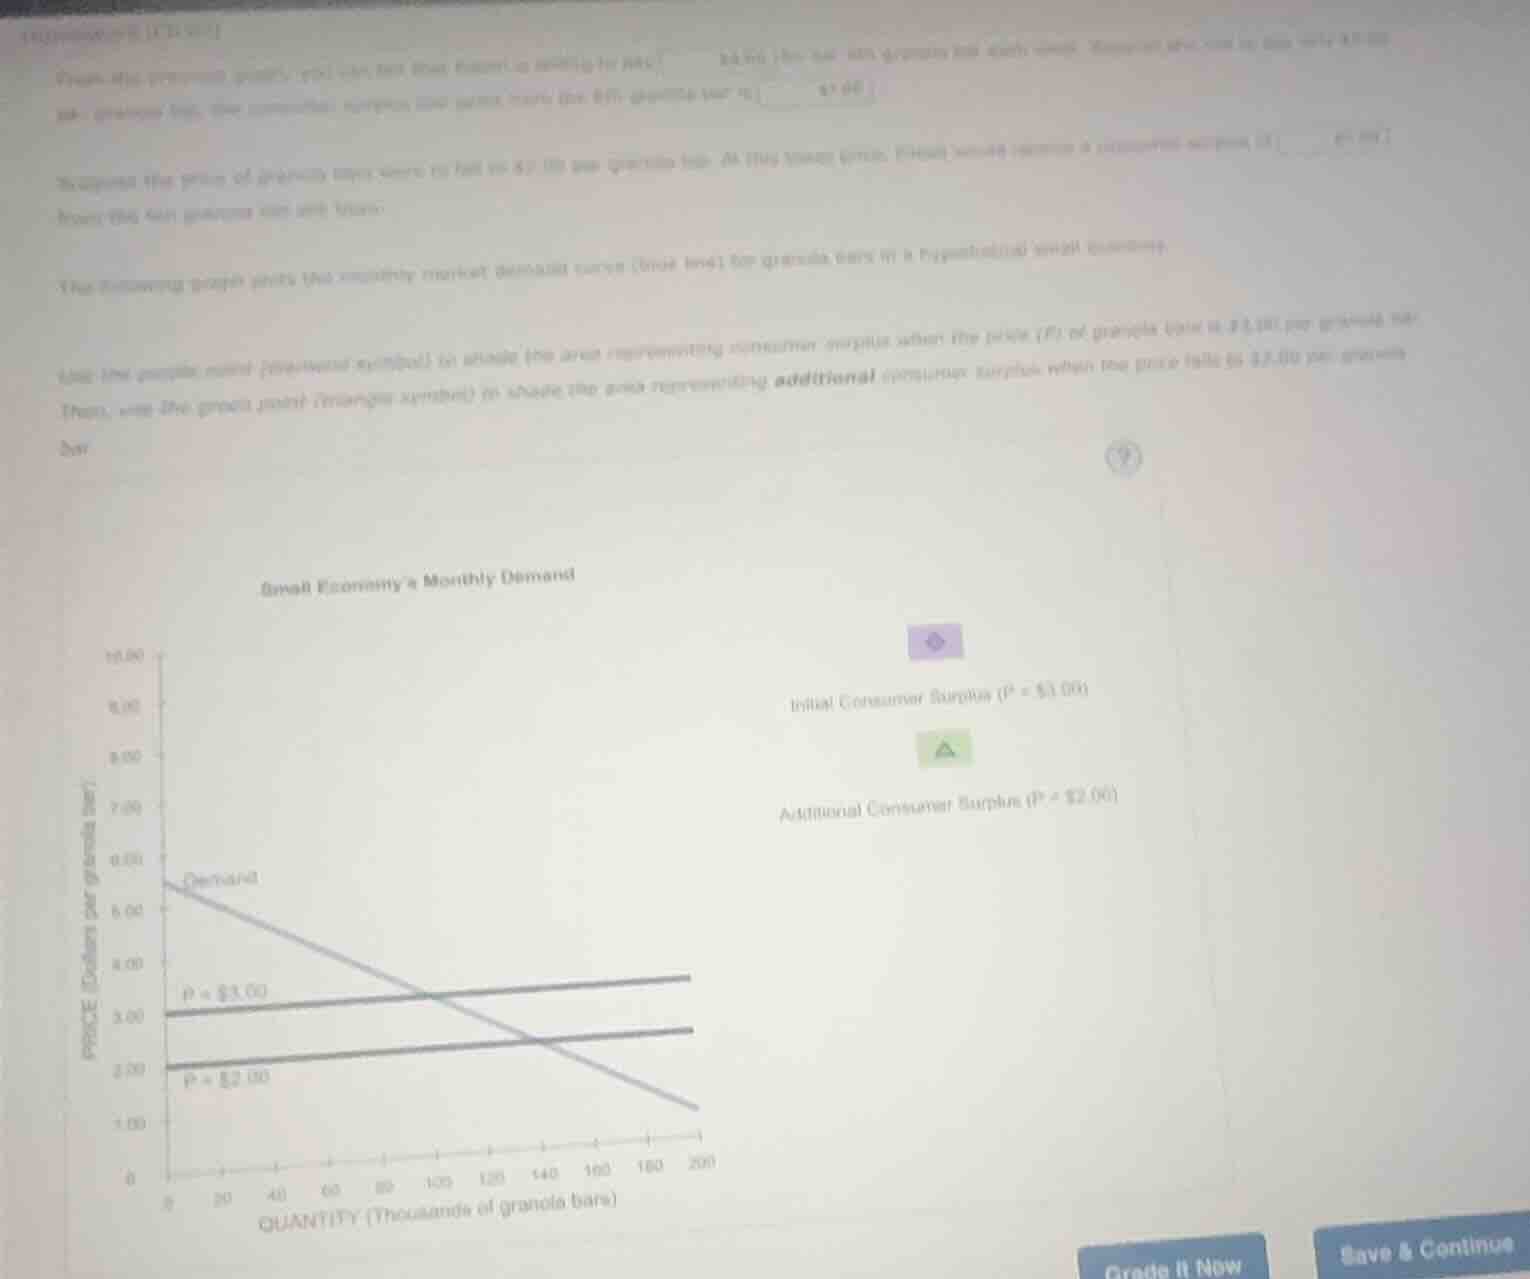
from this previous price, you can tell that demand for granola bars is elastic/inelastic. because total revenue will decrease/increase when price decreases. to confirm, calculate the price elasticity of demand for granola bars. at the lower price, total revenue will be $\underline{\quad\quad}$ per month from the sale of granola bars. the following graph shows the monthly market demand curve (black line) for granola bars in a hypothetical small economy. use the purple point (diamond symbol) to shade the area representing consumer surplus when the price (p) of granola bars is $3.00 per granola bar. then, use the green point (triangle symbol) to shade the area representing additional consumer surplus when the price falls to $2.00 per granola bar.
To solve the problem of shading consumer surplus areas, we analyze the demand curve and price levels:
Step 1: Initial Consumer Surplus (\( P = \$3.00 \))
Consumer surplus is the area below the demand curve and above the price level (\( P = \$3.00 \)).
- The demand curve is a straight line. At \( P = \$3.00 \), find the quantity demanded (where the horizontal price line \( P = \$3.00 \) intersects the demand curve).
- The area of consumer surplus is a triangle with:
- Base = quantity demanded at \( P = \$3.00 \) (let’s call this \( Q_1 \)).
- Height = vertical distance between the demand curve’s intercept (at \( Q = 0 \), price is \( \$6.50 \)) and \( P = \$3.00 \) (so \( 6.50 - 3.00 = \$3.50 \)).
Shade this triangular area below the demand curve and above \( P = \$3.00 \) using the purple triangle tool.
Step 2: Additional Consumer Surplus (\( P = \$2.00 \))
“Additional” consumer surplus is the area gained when the price falls from \( \$3.00 \) to \( \$2.00 \). This is the area:
- Below the demand curve,
- Above \( P = \$2.00 \),
- But below \( P = \$3.00 \) (since the initial surplus was above \( \$3.00 \)).
- At \( P = \$2.00 \), find the new quantity demanded (\( Q_2 \), where \( P = \$2.00 \) intersects the demand curve).
- The additional surplus is a trapezoid (or a triangle + rectangle) between \( P = \$2.00 \) and \( P = \$3.00 \), from \( Q_1 \) to \( Q_2 \).
Shade this area below the demand curve, above \( P = \$2.00 \), and between \( Q_1 \) and \( Q_2 \) using the green triangle tool.
Key Intuition
Consumer surplus increases when price falls because:
- Existing buyers pay less (gaining surplus on their original quantity).
- New buyers enter the market (gaining surplus on the additional quantity).
For the graph:
- Purple Triangle: Shade the triangle above \( P = \$3.00 \), below the demand curve, and to the left of \( Q_1 \).
- Green Triangle: Shade the area between \( P = \$2.00 \), \( P = \$3.00 \), the demand curve, and between \( Q_1 \) and \( Q_2 \).
(Note: The exact coordinates depend on the demand curve’s equation, but the process relies on identifying the area between the demand curve and the price levels.)

Snap & solve any problem in the app
Get step-by-step solutions on Sovi AI
Photo-based solutions with guided steps
Explore more problems and detailed explanations
To solve the problem of shading consumer surplus areas, we analyze the demand curve and price levels:
Step 1: Initial Consumer Surplus (\( P = \$3.00 \))
Consumer surplus is the area below the demand curve and above the price level (\( P = \$3.00 \)).
- The demand curve is a straight line. At \( P = \$3.00 \), find the quantity demanded (where the horizontal price line \( P = \$3.00 \) intersects the demand curve).
- The area of consumer surplus is a triangle with:
- Base = quantity demanded at \( P = \$3.00 \) (let’s call this \( Q_1 \)).
- Height = vertical distance between the demand curve’s intercept (at \( Q = 0 \), price is \( \$6.50 \)) and \( P = \$3.00 \) (so \( 6.50 - 3.00 = \$3.50 \)).
Shade this triangular area below the demand curve and above \( P = \$3.00 \) using the purple triangle tool.
Step 2: Additional Consumer Surplus (\( P = \$2.00 \))
“Additional” consumer surplus is the area gained when the price falls from \( \$3.00 \) to \( \$2.00 \). This is the area:
- Below the demand curve,
- Above \( P = \$2.00 \),
- But below \( P = \$3.00 \) (since the initial surplus was above \( \$3.00 \)).
- At \( P = \$2.00 \), find the new quantity demanded (\( Q_2 \), where \( P = \$2.00 \) intersects the demand curve).
- The additional surplus is a trapezoid (or a triangle + rectangle) between \( P = \$2.00 \) and \( P = \$3.00 \), from \( Q_1 \) to \( Q_2 \).
Shade this area below the demand curve, above \( P = \$2.00 \), and between \( Q_1 \) and \( Q_2 \) using the green triangle tool.
Key Intuition
Consumer surplus increases when price falls because:
- Existing buyers pay less (gaining surplus on their original quantity).
- New buyers enter the market (gaining surplus on the additional quantity).
For the graph:
- Purple Triangle: Shade the triangle above \( P = \$3.00 \), below the demand curve, and to the left of \( Q_1 \).
- Green Triangle: Shade the area between \( P = \$2.00 \), \( P = \$3.00 \), the demand curve, and between \( Q_1 \) and \( Q_2 \).
(Note: The exact coordinates depend on the demand curve’s equation, but the process relies on identifying the area between the demand curve and the price levels.)