QUESTION IMAGE
Question
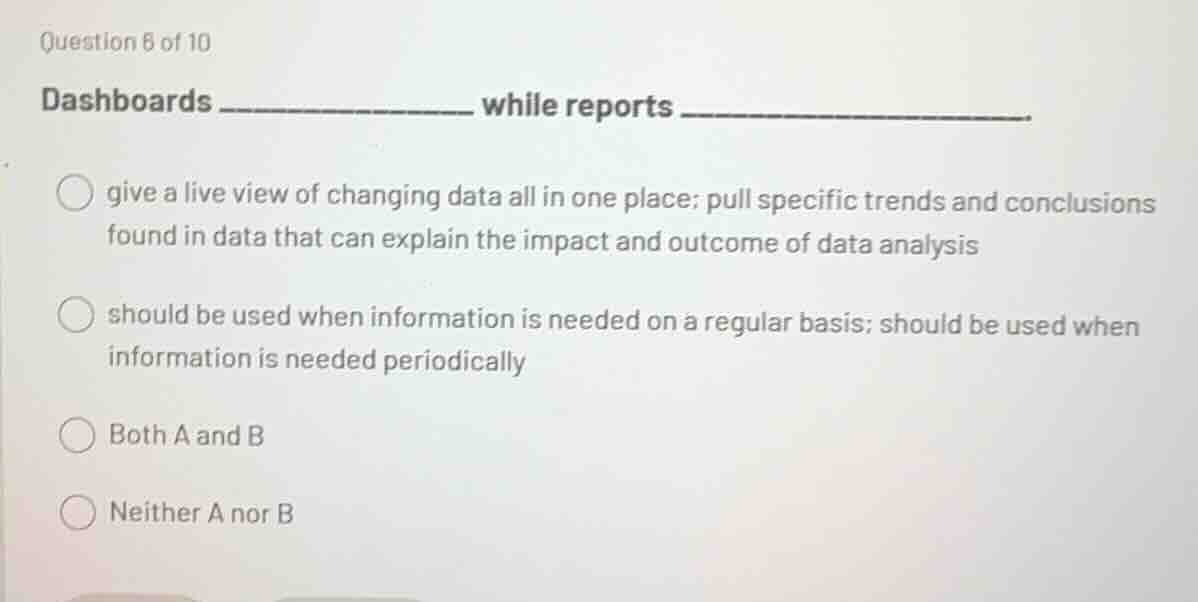
question 8 of 10
dashboards ____________ while reports _______________.
○ give a live view of changing data all in one place; pull specific trends and conclusions
found in data that can explain the impact and outcome of data analysis
○ should be used when information is needed on a regular basis; should be used when
information is needed periodically
○ both a and b
○ neither a nor b
Brief Explanations
- Analyze Option A: Dashboards typically provide a real - time, consolidated view of changing data. Reports are used to extract trends, conclusions from data and explain the impact of data analysis. This is a correct description of the roles of dashboards and reports.
- Analyze Option B: Dashboards are useful for regular information needs (as they show real - time/up - to - date data regularly), and reports are used periodically (for in - depth analysis at certain intervals). This is also a correct description.
- Since both A and B are correct, the answer is "Both A and B".

Snap & solve any problem in the app
Get step-by-step solutions on Sovi AI
Photo-based solutions with guided steps
Explore more problems and detailed explanations
C. Both A and B