QUESTION IMAGE
Question
question 3 of 10
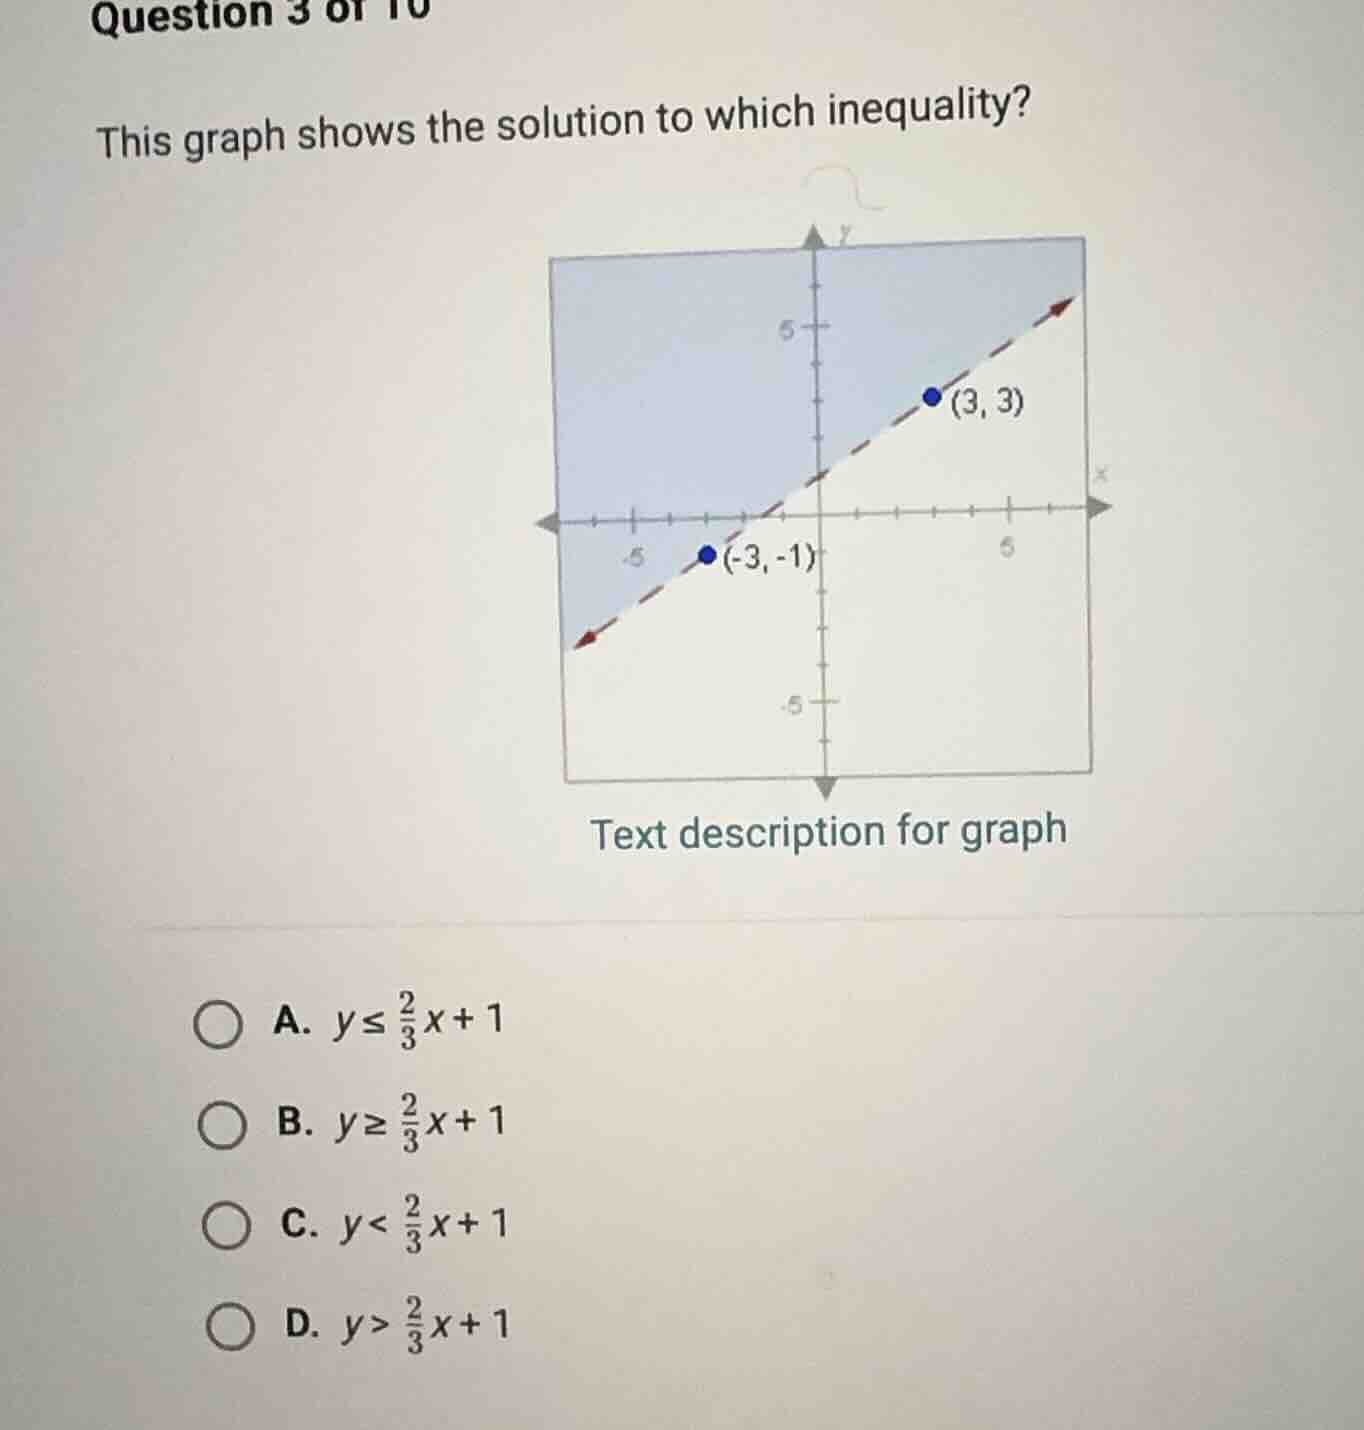
this graph shows the solution to which inequality?
text description for graph
a. $y \leq \frac{2}{3}x + 1$
b. $y \geq \frac{2}{3}x + 1$
c. $y < \frac{2}{3}x + 1$
d. $y > \frac{2}{3}x + 1$
Step1: Find line slope
Slope formula: $m=\frac{y_2-y_1}{x_2-x_1}$
Using points $(-3,-1),(3,3)$:
$m=\frac{3-(-1)}{3-(-3)}=\frac{4}{6}=\frac{2}{3}$
Step2: Find line equation
Use point-slope form $y-y_1=m(x-x_1)$
With $(3,3)$:
$y-3=\frac{2}{3}(x-3)$
Simplify: $y=\frac{2}{3}x+1$
Step3: Analyze line type
Dashed line means no equality ($<$/$>$)
Step4: Test region inequality
Test $(0,0)$: shaded region includes it.
$0 > \frac{2}{3}(0)+1$? No. $0 < \frac{2}{3}(0)+1$? No. Wait, test $(0,2)$ (in shaded area):
$2 > \frac{2}{3}(0)+1$ → $2>1$, true.

Snap & solve any problem in the app
Get step-by-step solutions on Sovi AI
Photo-based solutions with guided steps
Explore more problems and detailed explanations
D. $y> \frac{2}{3}x+1$