QUESTION IMAGE
Question
question 8 of 25
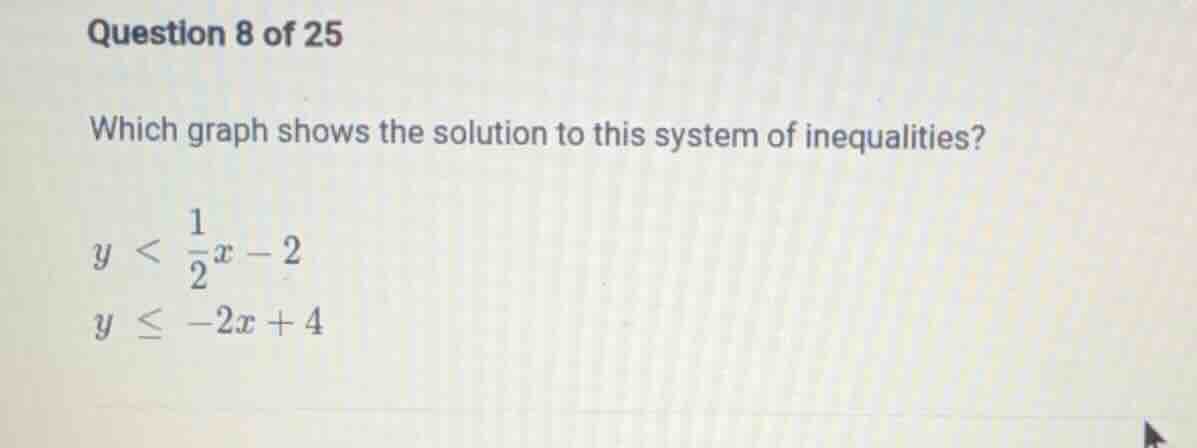
which graph shows the solution to this system of inequalities?
$y < \frac{1}{2}x - 2$
$y \leq -2x + 4$
Step1: Analyze \( y < \frac{1}{2}x - 2 \)
The inequality \( y < \frac{1}{2}x - 2 \) represents a line with slope \( \frac{1}{2} \) and y - intercept \( - 2 \). Since the inequality is strict (\(<\)), the line should be dashed. The region below this line (because \( y\) is less than the expression) is part of the solution for this inequality.
Step2: Analyze \( y \leq - 2x + 4 \)
The inequality \( y \leq - 2x + 4 \) represents a line with slope \( - 2 \) and y - intercept \( 4 \). Since the inequality is non - strict (\(\leq\)), the line should be solid. The region below or on this line (because \( y\) is less than or equal to the expression) is part of the solution for this inequality.
Step3: Find the intersection region
The solution to the system of inequalities is the region that is common to both the region defined by \( y < \frac{1}{2}x - 2 \) and the region defined by \( y \leq - 2x + 4 \). To identify the correct graph, we look for a graph with a dashed line for \( y=\frac{1}{2}x - 2 \) (slope \( \frac{1}{2}\), y - intercept - 2) and a solid line for \( y = - 2x+4 \) (slope - 2, y - intercept 4), and the overlapping region (the region that is below the dashed line \( y=\frac{1}{2}x - 2 \) and below or on the solid line \( y=-2x + 4\)).
(Note: Since the actual graphs are not provided here, but the process to identify the correct graph is as above. If we were to sketch it:
- For \( y=\frac{1}{2}x - 2\), when \( x = 0\), \( y=-2\); when \( y = 0\), \(x = 4\). Draw a dashed line through \((0,-2)\) and \((4,0)\) and shade below it.
- For \( y=-2x + 4\), when \( x = 0\), \( y = 4\); when \( y=0\), \(x = 2\). Draw a solid line through \((0,4)\) and \((2,0)\) and shade below it. The intersection of the two shaded regions is the solution.)

Snap & solve any problem in the app
Get step-by-step solutions on Sovi AI
Photo-based solutions with guided steps
Explore more problems and detailed explanations
To determine the correct graph, we analyze the two inequalities:
- For \( y < \frac{1}{2}x - 2\): The line \( y=\frac{1}{2}x - 2\) (slope \( \frac{1}{2}\), y - intercept \(-2\)) is dashed, and the region below the line is shaded.
- For \( y \leq - 2x + 4\): The line \( y=-2x + 4\) (slope \(-2\), y - intercept \(4\)) is solid, and the region below or on the line is shaded.
The correct graph is the one that has a dashed line for \( y = \frac{1}{2}x-2\), a solid line for \( y=-2x + 4\), and the overlapping region (below the dashed line and below/on the solid line) shaded. If we assume the options are in a standard format (e.g., with the correct line styles and shaded region), the graph that matches these criteria is the answer. (Since the actual graph options are not fully visible, but the above is the method to identify it)