QUESTION IMAGE
Question
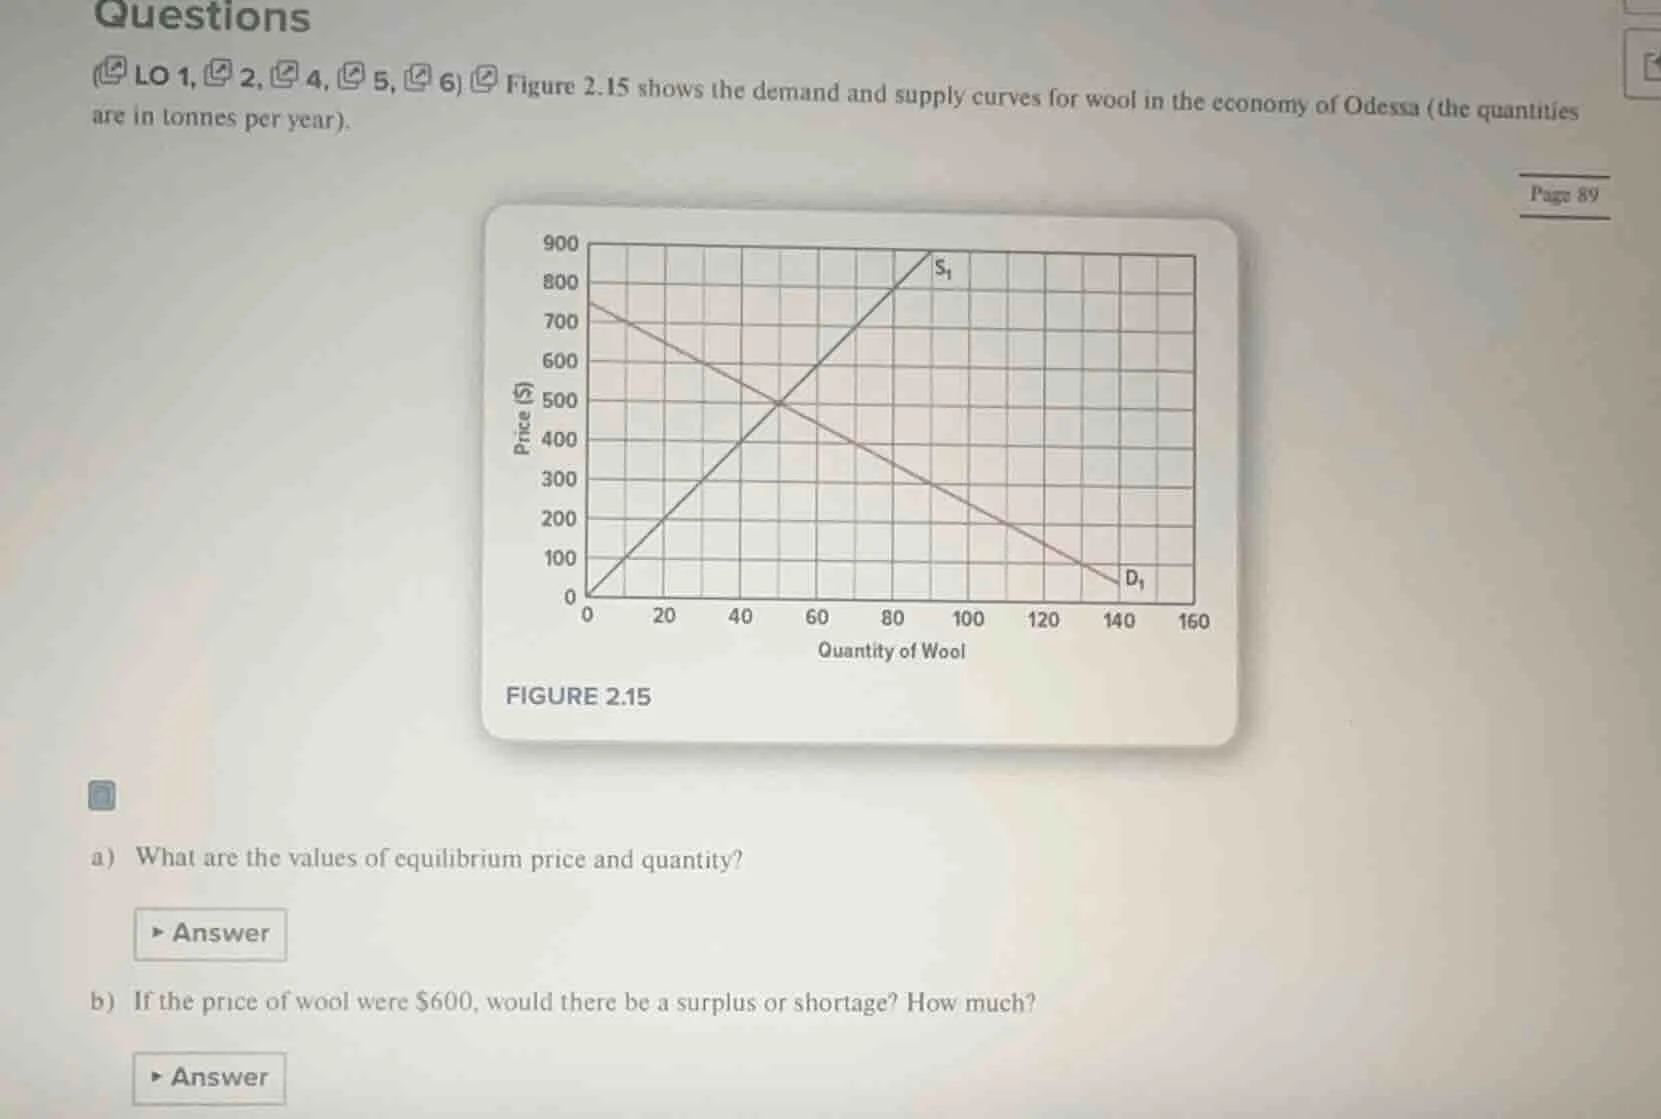
questions (lo 1, 2, 4, 5, 6) figure 2.15 shows the demand and supply curves for wool in the economy of odessa (the quantities are in tonnes per year). figure 2.15 (a) what are the values of equilibrium price and quantity? (b) if the price of wool were $600, would there be a surplus or shortage? how much?
Part (a)
Step1: Identify Equilibrium Point
The equilibrium in a supply - demand graph is where the supply curve ($S_1$) and demand curve ($D_1$) intersect. From the given graph, we look for the point where the two curves cross each other.
Step2: Read Coordinates at Intersection
At the intersection point of the supply and demand curves, we can read the price (y - axis) and quantity (x - axis) values. From the graph, the intersection occurs at a price of $\$500$ and a quantity of 50 tonnes per year? Wait, no, looking at the grid, the x - axis (quantity) at intersection: let's check the grid. The supply curve $S_1$ and demand curve $D_1$ intersect where quantity is 50? Wait, no, the grid lines: the x - axis has marks at 0,20,40,60,... and y - axis at 0,100,200,... Wait, the intersection point: looking at the graph, the demand curve starts at (0,750) maybe? Wait, no, the y - axis is price in dollars. Wait, the supply curve $S_1$ goes from (0,0) to (90,900)? Wait, no, the graph shows that at quantity 50 (wait, no, the x - axis is quantity of wool, with grid lines. Let's re - examine: the supply curve $S_1$ and demand curve $D_1$ intersect at a point where the x - coordinate (quantity) is 50? No, wait, the grid: each square on x - axis: from 0 to 20 is one square? Wait, the x - axis labels are 0,20,40,60,80,100,120,140,160. The y - axis labels are 0,100,200,300,400,500,600,700,800,900. The supply curve $S_1$: when quantity is 40, price is 400; quantity 50, price 500? Wait, no, the demand curve: when quantity is 0, price is 750? Wait, no, the demand curve starts at (0,750) and goes down. The supply curve starts at (0,0) and goes up. The intersection point: looking at the graph, the two curves cross at a point where price is $\$500$ and quantity is 50? Wait, no, the x - axis at the intersection: let's count the grid. The intersection is at x = 50? Wait, no, the x - axis has a grid where each major tick is 20 units? Wait, no, the x - axis labels are 0,20,40,60,80,100,120,140,160. So the distance between 0 and 20 is one interval. The supply curve: when x = 40, y = 400; x = 50, y = 500? The demand curve: when x = 0, y = 750; x = 50, y = 500? Yes, because the demand curve is a straight line decreasing from (0,750) to (150, 0) maybe? Wait, no, at x = 140, y = 50? No, the y - axis at x = 140, the demand curve is at y = 50? No, the y - axis is price in dollars. Wait, I think I made a mistake. Let's look again: the supply curve $S_1$: from (0,0) to (90,900)? No, the top of $S_1$ is at (90,900)? No, the graph shows $S_1$ going to (90,900)? Wait, the y - axis maximum is 900, x - axis maximum 160. The intersection point: the two curves cross at (50, 500)? Wait, no, the x - axis at the intersection: let's see the grid. The intersection is at x = 50 (quantity) and y = 500 (price). Wait, no, the x - axis labels: 0,20,40,60,80,100,120,140,160. So each small grid square on x - axis is 10 units? Wait, between 0 and 20, there are two small squares? So each small square is 10 units. So the intersection point: x = 50 (since from 0, 5 small squares of 10 units each: 0+105 = 50) and y = 500 (since from 0, 5 small squares of 100 units each: 0 + 1005=500). So the equilibrium price is $\$500$ and equilibrium quantity is 50 tonnes per year? Wait, no, that can't be. Wait, maybe the x - axis is in units where each major tick is 20, so 0,20,40,60,... So the intersection is at x = 50? No, 50 is between 40 and 60. Wait, the supply curve: when x = 40, y = 400; x = 50, y = 500; x = 60, y = 600. The demand curve: when x = 0, y = 750; x = 50, y = 500; x = 100, y = 250. Yes, so…
Step1: Find Quantity Supplied and Demanded at $P = 600$
- Quantity Supplied ($Q_s$): For the supply curve $S_1$, we can find the quantity supplied at $P=\$600$. From the supply curve, we know that the supply curve is a straight line from (0,0) with a slope. We can see that when $P = 400$, $Q_s=40$; when $P = 500$, $Q_s = 50$; when $P=600$, $Q_s=60$ (since for every $\$100$ increase in price, quantity supplied increases by 10 tonnes? Wait, from (0,0) to (90,900), the slope is $\frac{900 - 0}{90 - 0}=10$. So $Q_s=\frac{P}{10}$. So when $P = 600$, $Q_s=\frac{600}{10}=60$ tonnes.
- Quantity Demanded ($Q_d$): For the demand curve $D_1$, we can find the quantity demanded at $P = \$600$. The demand curve is a straight line. We know that at $P = 500$, $Q_d=50$; at $P = 0$, $Q_d = 75$? Wait, no, let's find the equation of the demand curve. The demand curve passes through (0,750) and (150, 0) (since when $P = 0$, $Q_d=150$? Wait, no, at $P = 500$, $Q_d = 50$? No, I think my earlier assumption was wrong. Let's use two points on the demand curve. When $P = 750$, $Q_d=0$? No, at $P = 0$, $Q_d=150$? Wait, the demand curve: when $x = 0$ (quantity), $y = 750$ (price); when $x = 150$ (quantity), $y = 0$ (price). So the equation of the demand curve is $P=750 - 5Q_d$ (since the slope $m=\frac{0 - 750}{150 - 0}=- 5$). So when $P = 600$, we solve for $Q_d$:
$600=750 - 5Q_d$
$5Q_d=750 - 600$
$5Q_d = 150$
$Q_d = 30$ tonnes.
Step2: Determine Surplus/Shortage
Surplus is when $Q_s>Q_d$, shortage when $Q_d>Q_s$. Here, $Q_s = 60$ tonnes, $Q_d = 30$ tonnes. So $Q_s>Q_d$, so there is a surplus. The amount of surplus is $Q_s - Q_d=60 - 30 = 30$ tonnes.

Snap & solve any problem in the app
Get step-by-step solutions on Sovi AI
Photo-based solutions with guided steps
Explore more problems and detailed explanations
Equilibrium price is $\boldsymbol{\$500}$ and equilibrium quantity is $\boldsymbol{50}$ tonnes per year.