QUESTION IMAGE
Question
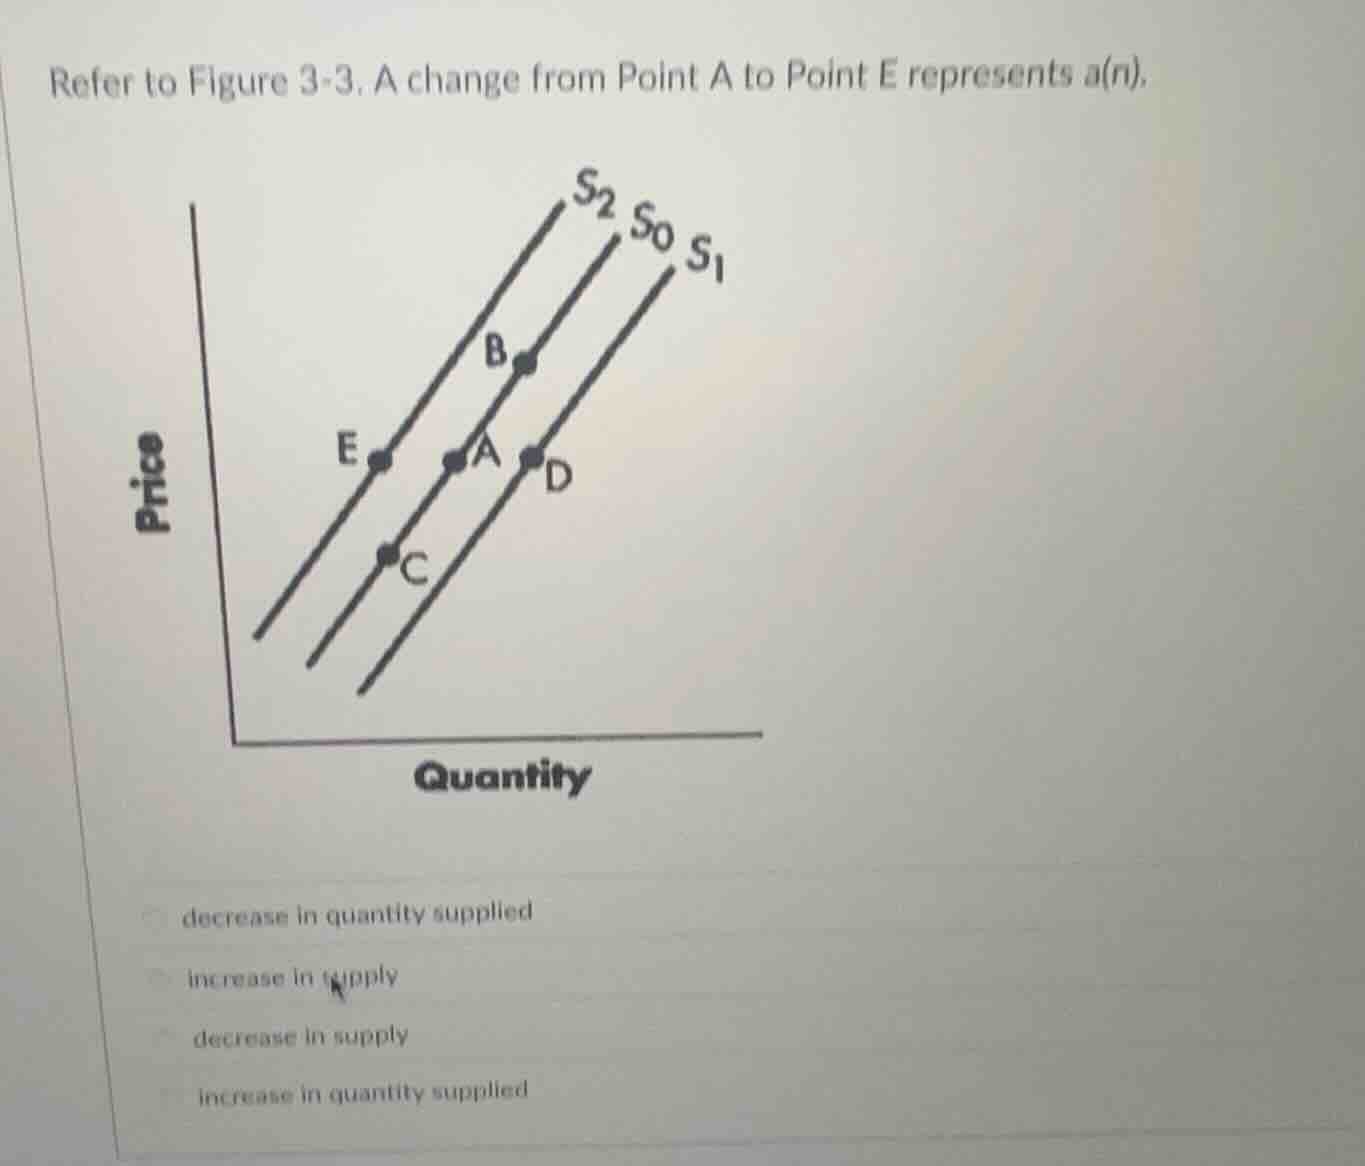
refer to figure 3-3. a change from point a to point e represents a(n).
decrease in quantity supplied
increase in supply
decrease in supply
increase in quantity supplied
Brief Explanations
A shift from Point A (on supply curve $S_0$) to Point E (on supply curve $S_2$) shows that at the same price level, the quantity supplied is lower, and the entire supply curve shifts leftward. This matches the definition of a decrease in supply, as it reflects a change in supply (a curve shift) rather than a change in quantity supplied (a movement along the same curve).

Snap & solve any problem in the app
Get step-by-step solutions on Sovi AI
Photo-based solutions with guided steps
Explore more problems and detailed explanations
decrease in supply