QUESTION IMAGE
Question
review & refresh
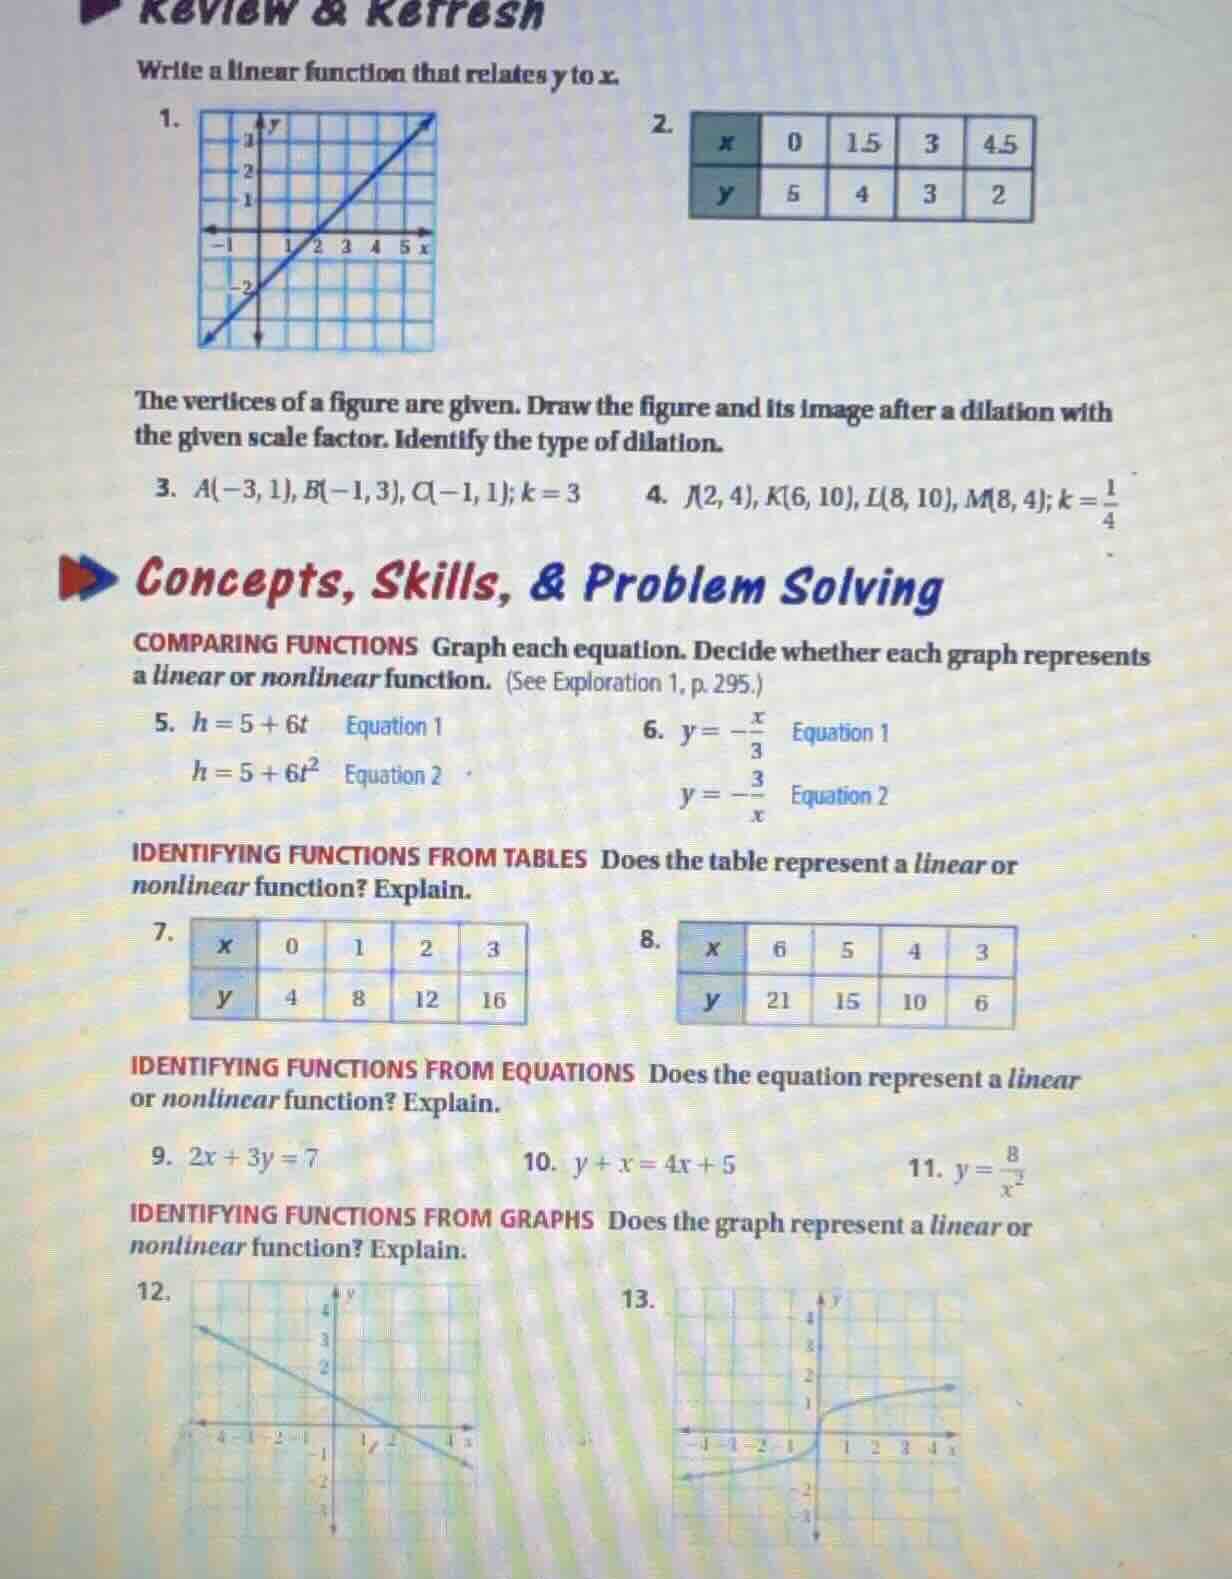
write a linear function that relates y to x.
1.
2.
| x | 0 | 1.5 | 3 | 4.5 |
| y | 5 | 4 | 3 | 2 |
the vertices of a figure are given. draw the figure and its image after a dilation with the given scale factor. identify the type of dilation.
- $a(-3, 1), b(-1, 3), c(-1, 1); k=3$
- $j(2, 4), k(6, 10), l(8, 10), m(8, 4); k=\frac{1}{4}$
concepts, skills, & problem solving
comparing functions graph each equation. decide whether each graph represents a linear or nonlinear function. (see exploration 1, p. 295.)
- $h = 5 + 6t$ equation 1
$h = 5 + 6t^2$ equation 2
- $y = -\frac{x}{3}$ equation 1
$y = -\frac{3}{x}$ equation 2
identifying functions from tables does the table represent a linear or nonlinear function? explain.
7.
| x | 0 | 1 | 2 | 3 |
| y | 4 | 8 | 12 | 16 |
8.
| x | 6 | 5 | 4 | 3 |
| y | 21 | 15 | 10 | 6 |
identifying functions from equations does the equation represent a linear or nonlinear function? explain.
- $2x + 3y = 7$
- $y + x = 4x + 5$
- $y = \frac{8}{x^2}$
identifying functions from graphs does the graph represent a linear or nonlinear function? explain.
12.
13.
Step1: Find slope from graph
Choose two points, e.g., $(2,0)$ and $(0,-1)$. Slope $m=\frac{0-(-1)}{2-0}=\frac{1}{2}$
Step2: Identify y-intercept
The line crosses y-axis at $(0,-1)$, so $b=-1$.
Step3: Write linear function
Substitute $m$ and $b$ into $y=mx+b$.
$y=\frac{1}{2}x - 1$
---
Step1: Calculate slope from table
Use points $(0,5)$ and $(1.5,4)$. $m=\frac{4-5}{1.5-0}=-\frac{2}{3}$
Step2: Identify y-intercept
When $x=0$, $y=5$, so $b=5$.
Step3: Write linear function
Substitute $m$ and $b$ into $y=mx+b$.
$y=-\frac{2}{3}x + 5$
---
Step1: Dilate each vertex by $k=3$
$A'(-3\times3, 1\times3)=(-9,3)$; $B'(-1\times3, 3\times3)=(-3,9)$; $C'(-1\times3,1\times3)=(-3,3)$
Step2: Identify dilation type
Scale factor $k>1$, so it is an enlargement.
---
Step1: Dilate each vertex by $k=\frac{1}{4}$
$J'(2\times\frac{1}{4}, 4\times\frac{1}{4})=(0.5,1)$; $K'(6\times\frac{1}{4},10\times\frac{1}{4})=(1.5,2.5)$; $L'(8\times\frac{1}{4},10\times\frac{1}{4})=(2,2.5)$; $M'(8\times\frac{1}{4},4\times\frac{1}{4})=(2,1)$
Step2: Identify dilation type
Scale factor $0 --- It follows $y=mx+b$ form, so linear. Graph is a straight line. Has squared variable $t^2$, so nonlinear. Graph is a parabola. --- It follows $y=mx+b$ form, so linear. Graph is a straight line. Has variable in denominator, so nonlinear. Graph is a hyperbola. --- $\frac{8-4}{1-0}=4$, $\frac{12-8}{2-1}=4$, $\frac{16-12}{3-2}=4$ Constant rate of change, so linear. --- $\frac{15-21}{5-6}=6$, $\frac{10-15}{4-5}=5$, $\frac{6-10}{3-4}=4$ Non-constant rate of change, so nonlinear. --- $2x+3y=7$ can be rewritten as $y=-\frac{2}{3}x+\frac{7}{3}$, follows $y=mx+b$. Linear, no exponents >1 on variables. --- $y+x=4x+5$ simplifies to $y=3x+5$, follows $y=mx+b$. Linear, no exponents >1 on variables. --- Variable $x$ is squared and in denominator, does not follow linear form. Nonlinear, has variable with negative exponent. --- Graph is a straight line with constant slope. Linear, straight line graph represents linear function. --- Graph is a curve with changing slope, not a straight line. Nonlinear, curved graph represents nonlinear function.Step1: Analyze Equation 1: $h=5+6t$
Step2: Analyze Equation 2: $h=5+6t^2$
Step1: Analyze Equation 1: $y=-\frac{x}{3}$
Step2: Analyze Equation 2: $y=-\frac{3}{x}$
Step1: Check rate of change
Step2: Classify function
Step1: Check rate of change
Step2: Classify function
Step1: Rewrite in standard linear form
Step2: Classify function
Step1: Simplify the equation
Step2: Classify function
Step1: Analyze the equation $y=\frac{8}{x^2}$
Step2: Classify function
Step1: Analyze the graph
Step2: Classify function
Step1: Analyze the graph
Step2: Classify function

Snap & solve any problem in the app
Get step-by-step solutions on Sovi AI
Photo-based solutions with guided steps
Explore more problems and detailed explanations
- $\boldsymbol{y=\frac{1}{2}x - 1}$
- $\boldsymbol{y=-\frac{2}{3}x + 5}$
- Dilation image vertices: $A'(-9,3)$, $B'(-3,9)$, $C'(-3,3)$; Type: Enlargement
- Dilation image vertices: $J'(0.5,1)$, $K'(1.5,2.5)$, $L'(2,2.5)$, $M'(2,1)$; Type: Reduction
- Equation 1: Linear (straight line graph); Equation 2: Nonlinear (parabola graph)
- Equation 1: Linear (straight line graph); Equation 2: Nonlinear (hyperbola graph)
- Linear; constant rate of change of 4 between $x$ and $y$
- Nonlinear; rate of change between $x$ and $y$ is not constant
- Linear; can be rewritten as $y=-\frac{2}{3}x+\frac{7}{3}$, fits linear form $y=mx+b$
- Linear; simplifies to $y=3x+5$, fits linear form $y=mx+b$
- Nonlinear; variable $x$ is in the denominator (equivalent to $x^{-2}$), does not fit linear form
- Linear; the graph is a straight line with a constant slope
- Nonlinear; the graph is a curve with a changing slope