QUESTION IMAGE
Question
savings matter for families at all income levels
figure 1
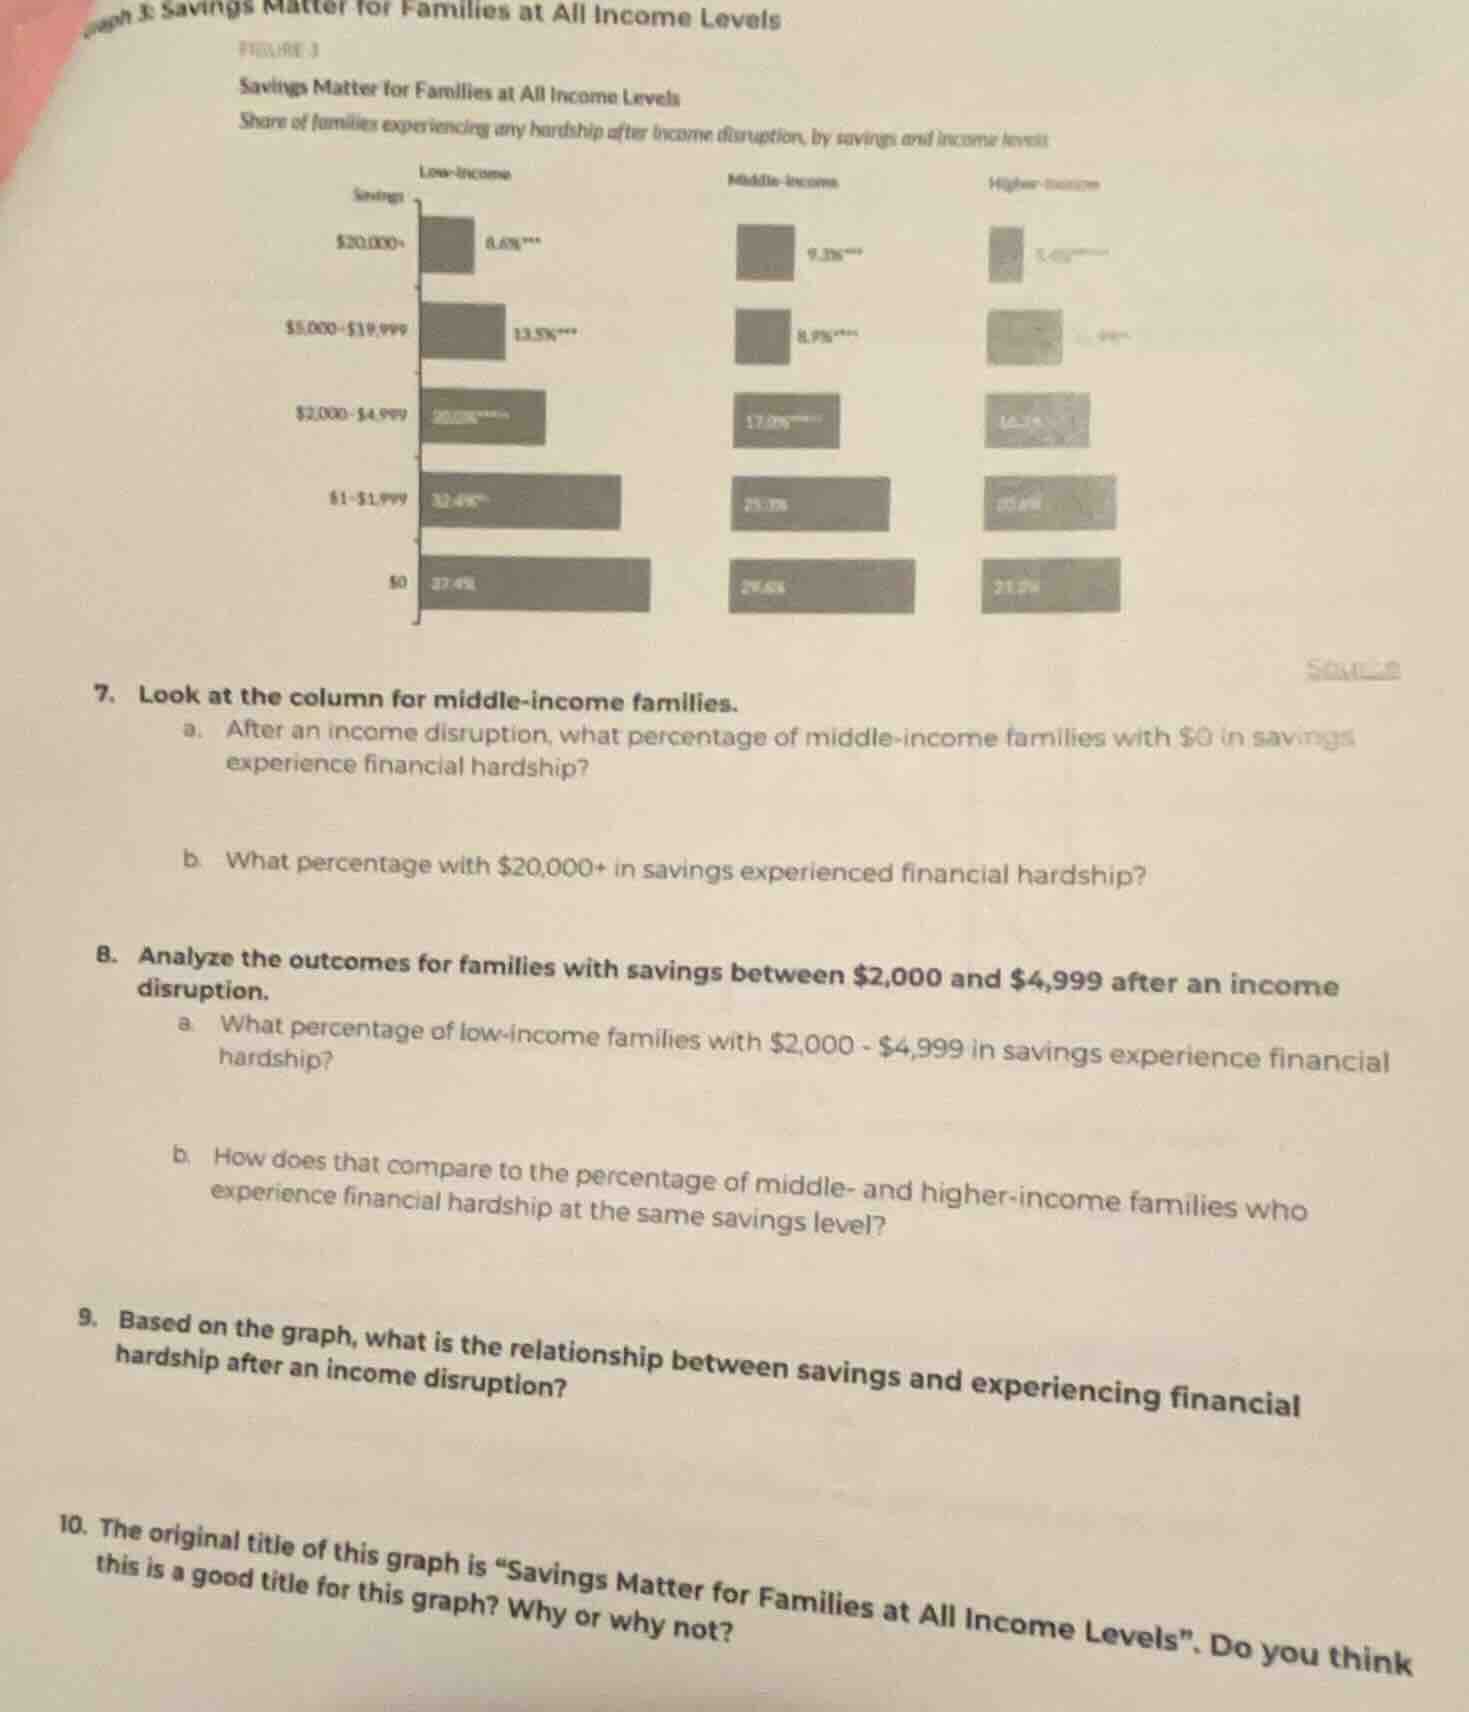
savings matter for families at all income levels
share of families experiencing any hardship after income disruption, by savings and income levels
- look at the column for middle - income families.
a. after an income disruption, what percentage of middle - income families with $0 in savings experience financial hardship?
b. what percentage with $20,000+ in savings experienced financial hardship?
- analyze the outcomes for families with savings between $2,000 and $4,999 after an income disruption.
a. what percentage of low - income families with $2,000 - $4,999 in savings experience financial hardship?
b. how does that compare to the percentage of middle - and higher - income families who experience financial hardship at the same savings level?
- based on the graph, what is the relationship between savings and experiencing financial hardship after an income disruption?
- the original title of this graph is “savings matter for families at all income levels”. do you think this is a good title for this graph? why or why not?
Question 7
a. Locate middle-income column, $0 savings row.
b. Locate middle-income column, $20,000+ savings row.
Question 8
a. Locate low-income column, $2,000-$4,999 savings row.
b. Compare low-income percentage to middle/higher-income percentages in the same savings row.
Question 9
Observe trend across all income groups as savings amounts increase.
Question 10
Evaluate if the title reflects the graph's core data on savings levels, income groups, and financial hardship risk.

Snap & solve any problem in the app
Get step-by-step solutions on Sovi AI
Photo-based solutions with guided steps
Explore more problems and detailed explanations
- a. 26.6%
b. 9.3%
- a. 26.0%
b. The 26.0% hardship rate for low-income families in this savings bracket is higher than the 17.2% rate for middle-income families and the 16.1% rate for higher-income families at the same savings level.
- Across all income levels, as the amount of savings a family has increases, the percentage of families experiencing financial hardship after an income disruption decreases.
- Yes, this is a good title. The graph clearly shows that for low-, middle-, and higher-income families, having higher savings correlates with lower rates of financial hardship after income disruption, directly demonstrating that savings matter for families at every income level.