QUESTION IMAGE
Question
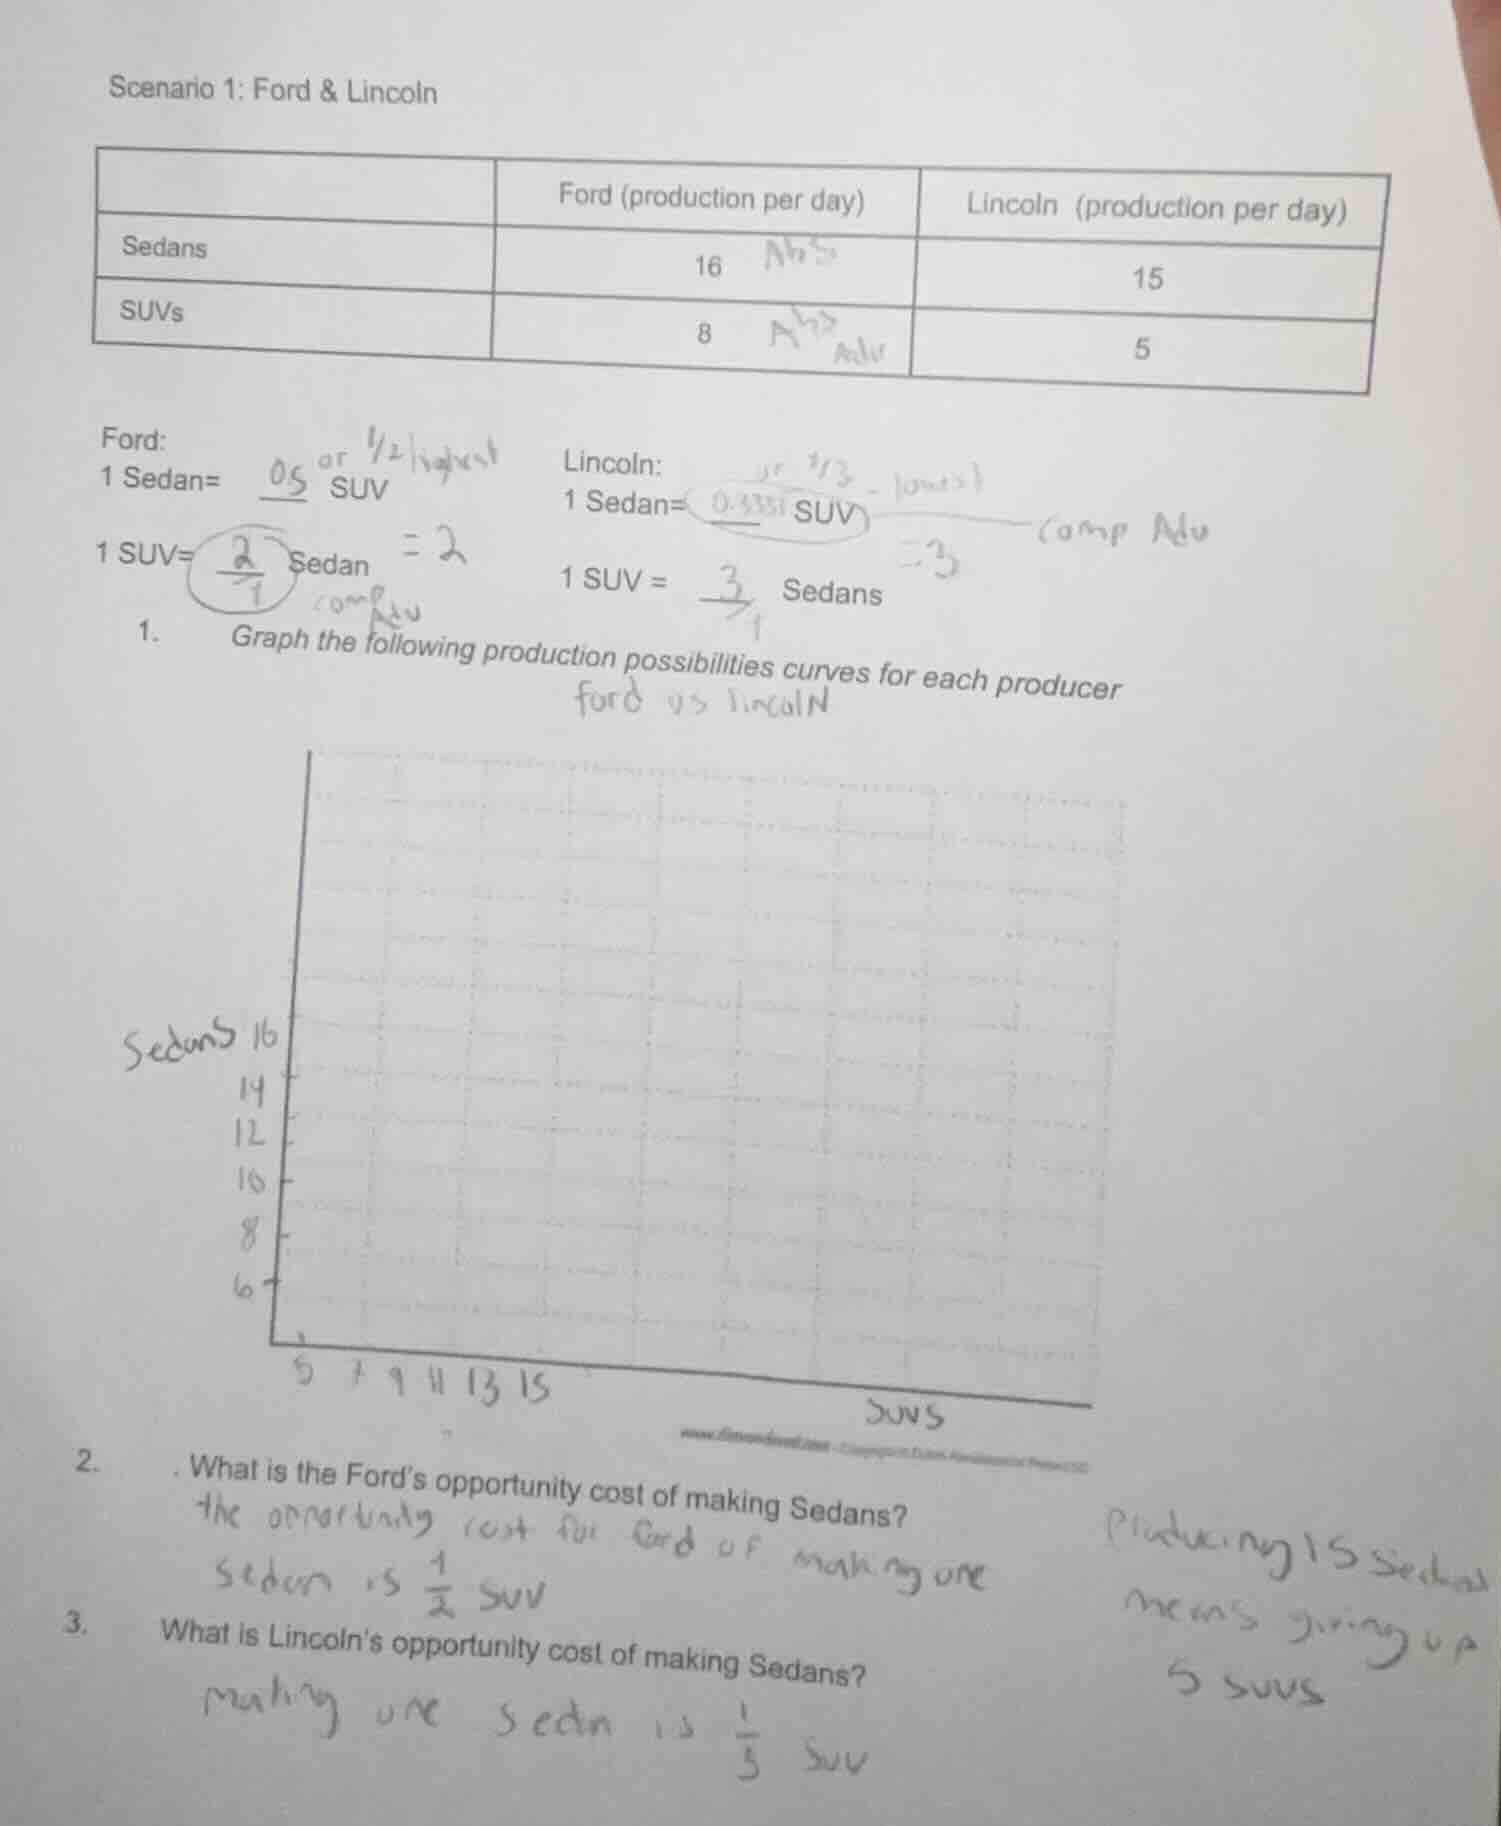
scenario 1: ford & lincoln
| ford (production per day) | lincoln (production per day) | |
|---|---|---|
| suvs | 8 | 5 |
ford:
1 sedan= 0.5 or $\frac{1}{2}$ suv
1 suv= $\frac{2}{1}$ sedan = 2
lincoln:
1 sedan= 0.333 suv
1 suv = $\frac{3}{1}$ sedans
- graph the following production possibilities curves for each producer
- what is the fords opportunity cost of making sedans?
- what is lincolns opportunity cost of making sedans?
Step1: Calculate Ford's sedan opportunity cost
Opportunity cost of 1 sedan = $\frac{\text{Max SUV production}}{\text{Max sedan production}} = \frac{8}{16} = \frac{1}{2}$
Step2: Calculate Lincoln's sedan opportunity cost
Opportunity cost of 1 sedan = $\frac{\text{Max SUV production}}{\text{Max sedan production}} = \frac{5}{15} = \frac{1}{3}$
Step3: Define PPF endpoints for Ford
- If Ford produces only sedans: (0 SUVs, 16 sedans)
- If Ford produces only SUVs: (8 SUVs, 0 sedans)
Step4: Define PPF endpoints for Lincoln
- If Lincoln produces only sedans: (0 SUVs, 15 sedans)
- If Lincoln produces only SUVs: (5 SUVs, 0 sedans)

Snap & solve any problem in the app
Get step-by-step solutions on Sovi AI
Photo-based solutions with guided steps
Explore more problems and detailed explanations
- Production Possibilities Curves (PPF):
- For Ford: Plot and connect the points (0, 16) and (8, 0) on the graph (SUVs on x-axis, sedans on y-axis).
- For Lincoln: Plot and connect the points (0, 15) and (5, 0) on the same graph.
- Ford's opportunity cost of making 1 sedan is $\frac{1}{2}$ SUV.
- Lincoln's opportunity cost of making 1 sedan is $\frac{1}{3}$ SUV.