QUESTION IMAGE
Question
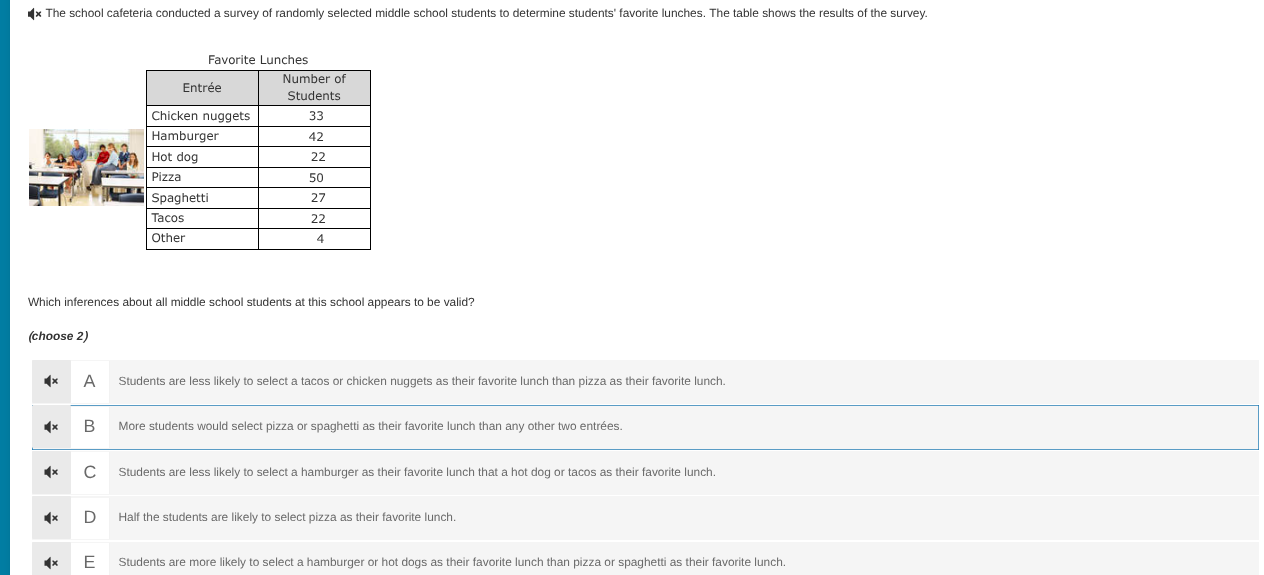
the school cafeteria conducted a survey of randomly selected middle school students to determine students favorite lunches. the table shows the results of the survey. favorite lunches entrée number of students chicken nuggets 33 hamburger 42 hot dog 22 pizza 50 spaghetti 27 tacos 22 other 4 which inferences about all middle school students at this school appears to be valid? (choose 2) a students are less likely to select a tacos or chicken nuggets as their favorite lunch than pizza as their favorite lunch. b more students would select pizza or spaghetti as their favorite lunch than any other two entrées. c students are less likely to select a hamburger as their favorite lunch that a hot dog or tacos as their favorite lunch. d half the students are likely to select pizza as their favorite lunch. e students are more likely to select a hamburger or hot dogs as their favorite lunch than pizza or spaghetti as their favorite lunch.
First, calculate the total number of students surveyed: \(33 + 42 + 22 + 50 + 27 + 22 + 4 = 200\).
- For Option A: Number of students who like tacos or chicken nuggets is \(22 + 33 = 55\). Number of students who like pizza is \(50\). Since \(55>50\), this inference is invalid.
- For Option B: Number of students who like pizza or spaghetti is \(50 + 27 = 77\). Let's check other pairs: hamburger + chicken nuggets = \(42 + 33 = 75\) (less than 77), hot dog + tacos = \(22 + 22 = 44\) (less than 77), etc. So this inference is valid.
- For Option C: Number of students who like hamburger is \(42\), number of students who like hot dog or tacos is \(22 + 22 = 44\). Since \(42<44\), this inference is valid.
- For Option D: Number of students who like pizza is \(50\), total is \(200\), \(50\) is a quarter (not half) of \(200\), so this inference is invalid.
- For Option E: Number of students who like hamburger or hot dogs is \(42 + 22 = 64\). Number of students who like pizza or spaghetti is \(50 + 27 = 77\). Since \(64<77\), this inference is invalid.

Snap & solve any problem in the app
Get step-by-step solutions on Sovi AI
Photo-based solutions with guided steps
Explore more problems and detailed explanations
B. More students would select pizza or spaghetti as their favorite lunch than any other two entrées, C. Students are less likely to select a hamburger as their favorite lunch that a hot dog or tacos as their favorite lunch.