QUESTION IMAGE
Question
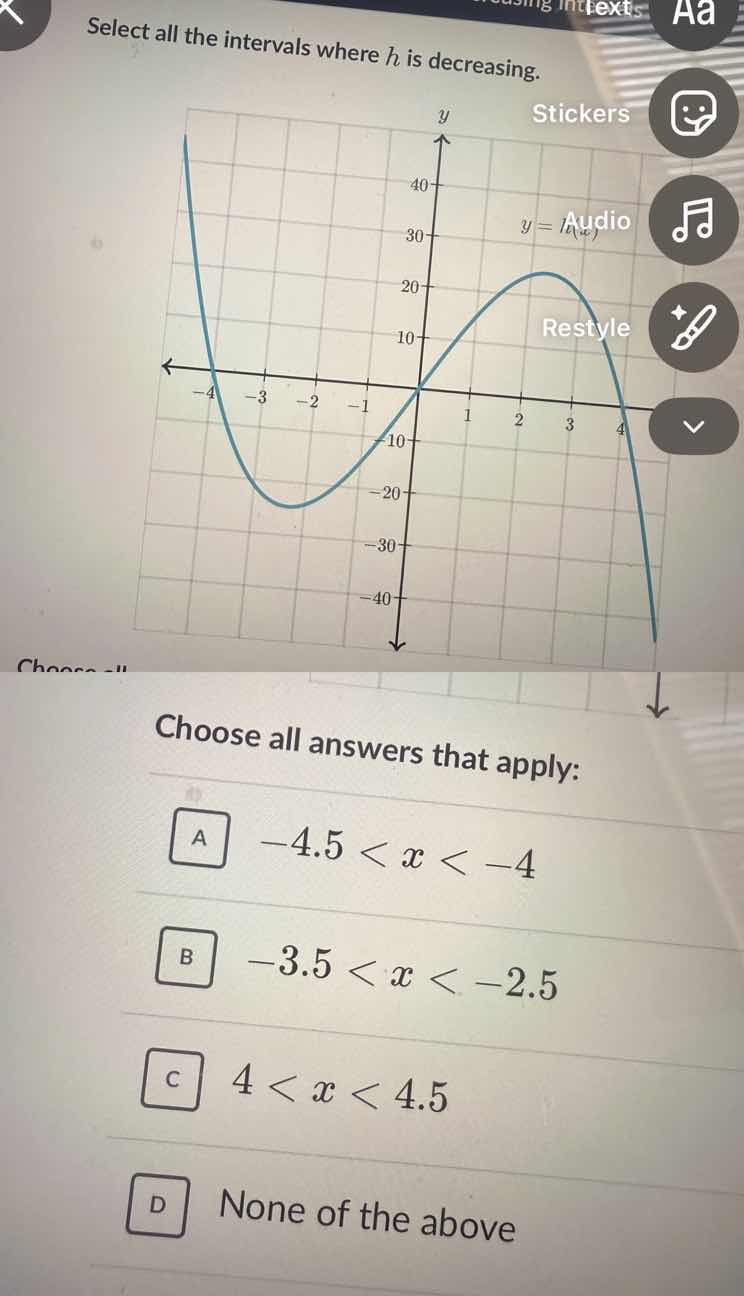
select all the intervals where ( h ) is decreasing.
( y = h(x) )
choose all answers that apply:
a ( -4.5 < x < -4 )
b ( -3.5 < x < -2.5 )
c ( 4 < x < 4.5 )
d none of the above
To determine where the function \( h(x) \) (represented by \( y = h(x) \)) is decreasing, we analyze the graph's slope: a function is decreasing when as \( x \) increases, \( y \) decreases.
Step 1: Analyze Option A (\(-4.5 < x < -4\))
On the graph, for \( x \) values between \(-4.5\) and \(-4\), as \( x \) increases (moves from left to right), the \( y \)-values decrease (the graph is falling). So \( h(x) \) is decreasing here.
Step 2: Analyze Option B (\(-3.5 < x < -2.5\))
For \( x \) between \(-3.5\) and \(-2.5\), as \( x \) increases, the \( y \)-values are still decreasing (the graph is at the "bottom" part of the left curve, continuing to fall towards the minimum). Wait, no—wait, the left part of the graph: from \( x < -3 \) (approx), the graph decreases until a minimum (around \( x = -2 \) or so), then increases. Wait, re-examining: the left curve starts high, decreases to a minimum (around \( x = -2 \)), then increases. So between \(-3.5\) and \(-2.5\), \( x \) is increasing, and \( y \) is decreasing (since we're moving towards the minimum). Wait, but let's check the graph again. Wait, the left side: at \( x = -4 \), the graph is high; as \( x \) increases to \(-3\), \(-2\), etc., it decreases to a minimum (around \( x = -2 \)), then increases. So \(-3.5\) to \(-2.5\) is within the decreasing interval of the left curve. Wait, but let's check the options. Wait, no—wait, the right curve: after the peak (around \( x = 3 \)), the graph decreases as \( x \) increases beyond \( 3 \).
Wait, no—let's re-express:
- Left curve: from \( x = -\infty \) (or the left end) to \( x = -2 \) (approx minimum), the function is decreasing (as \( x \) increases, \( y \) decreases).
- Then, from \( x = -2 \) to \( x = 3 \) (approx peak), the function is increasing (as \( x \) increases, \( y \) increases).
- Then, from \( x = 3 \) to \( x = \infty \) (right end), the function is decreasing (as \( x \) increases, \( y \) decreases).
Now, check each option:
- Option A: \(-4.5 < x < -4\): within the left decreasing interval (since \( -4.5 < -4 < -2 \)), so \( h(x) \) is decreasing here.
- Option B: \(-3.5 < x < -2.5\): also within the left decreasing interval (\( -3.5 < -2.5 < -2 \)), so \( h(x) \) is decreasing here. Wait, but is that correct? Wait, the minimum is around \( x = -2 \), so from \( x = -4.5 \) to \( x = -2 \), the function is decreasing. So \(-3.5\) to \(-2.5\) is within that, so \( y \) decreases as \( x \) increases.
- Option C: \( 4 < x < 4.5 \): within the right decreasing interval (since \( 4 > 3 \), and after the peak, the function decreases). So as \( x \) increases from \( 4 \) to \( 4.5 \), \( y \) decreases.
Wait, but let's check the graph again. The user's graph:
- Left side: starts high, goes down to a minimum (around \( x = -2 \)), then up to a peak (around \( x = 3 \)), then down.
So:
- For \( x \) in \(-4.5 < x < -4\): \( x \) increases, \( y \) decreases (A is correct).
- For \( x \) in \(-3.5 < x < -2.5\): \( x \) increases, \( y \) decreases (B is correct? Wait, no—wait, if the minimum is at \( x = -2 \), then from \( x = -4 \) to \( x = -2 \), the function is decreasing. So \(-3.5\) to \(-2.5\) is within that, so \( y \) decreases as \( x \) increases. So B is also correct? Wait, but maybe I made a mistake. Wait, let's check the options again. Wait, the options:
A: \(-4.5 < x < -4\): yes, decreasing.
B: \(-3.5 < x < -2.5\): yes, decreasing (since moving from \( -3.5 \) to \( -2.5 \), \( x \) increases, \( y \) decreases).
C: \( 4 < x < 4.5 \): yes, decreasing (since after the peak, \( x >…

Snap & solve any problem in the app
Get step-by-step solutions on Sovi AI
Photo-based solutions with guided steps
Explore more problems and detailed explanations
A. \(-4.5 < x < -4\), B. \(-3.5 < x < -2.5\), C. \(4 < x < 4.5\)