QUESTION IMAGE
Question
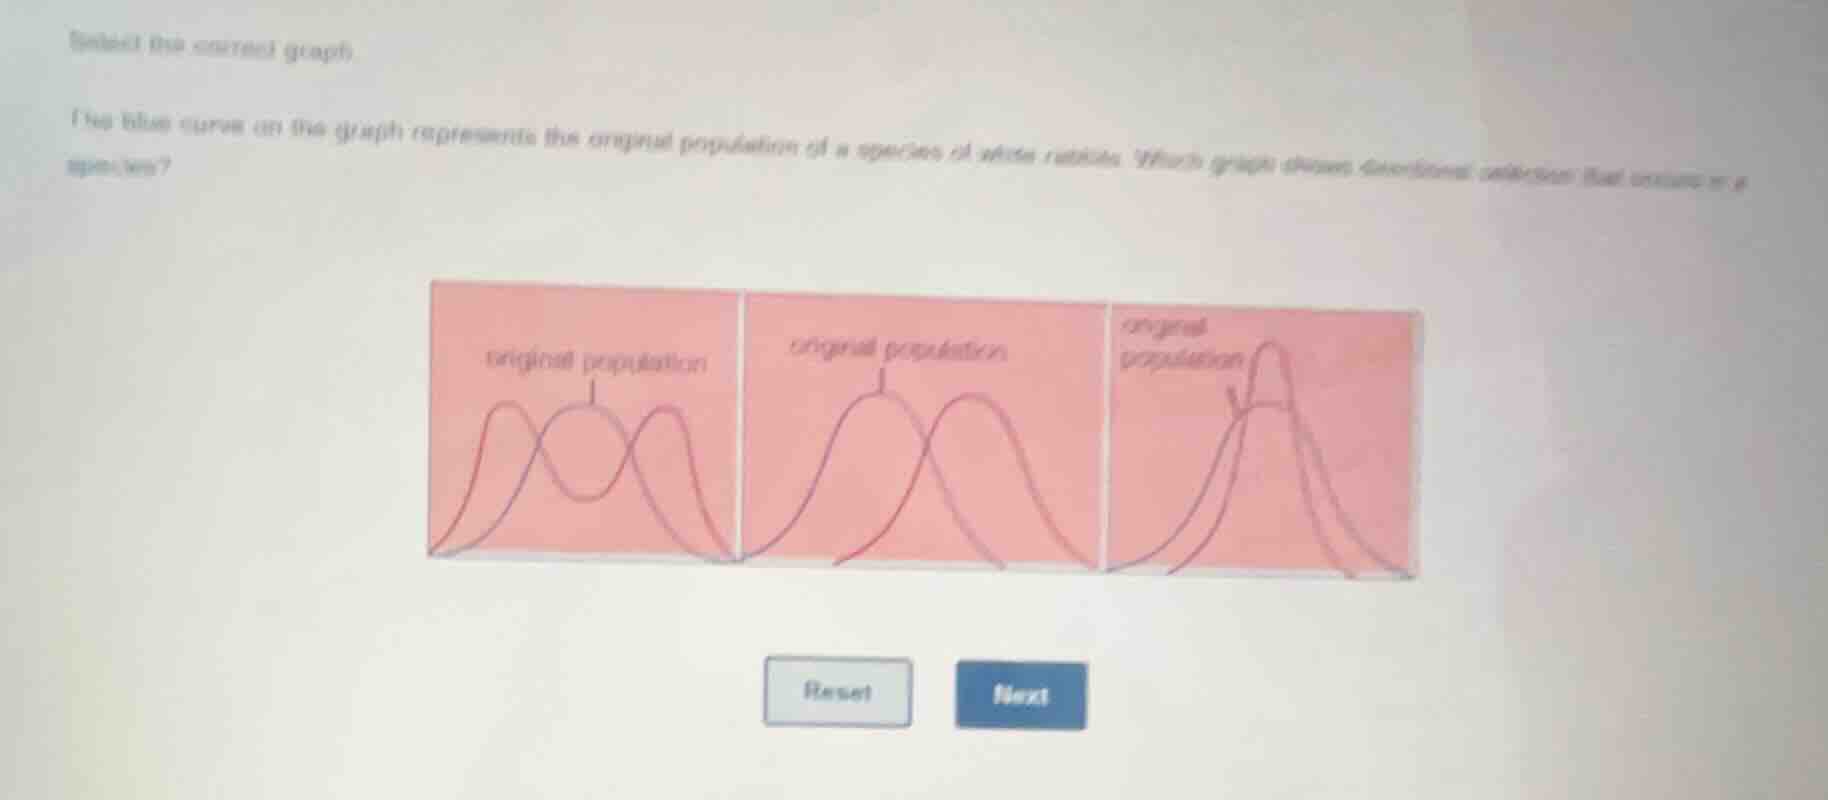
select the correct graph.
the blue curve on the graph represents the original population of a species of white rabbits. which graph shows directional selection that occurs in a species?
Directional selection shifts the population's trait distribution toward one extreme, reducing variation and moving the peak of the curve away from the original population's peak. The third graph shows the new population curve peaked at one extreme of the original population's range, matching this pattern.

Snap & solve any problem in the app
Get step-by-step solutions on Sovi AI
Photo-based solutions with guided steps
Explore more problems and detailed explanations
The rightmost (third) graph, where the new population curve is shifted to one extreme of the original population curve.