QUESTION IMAGE
Question
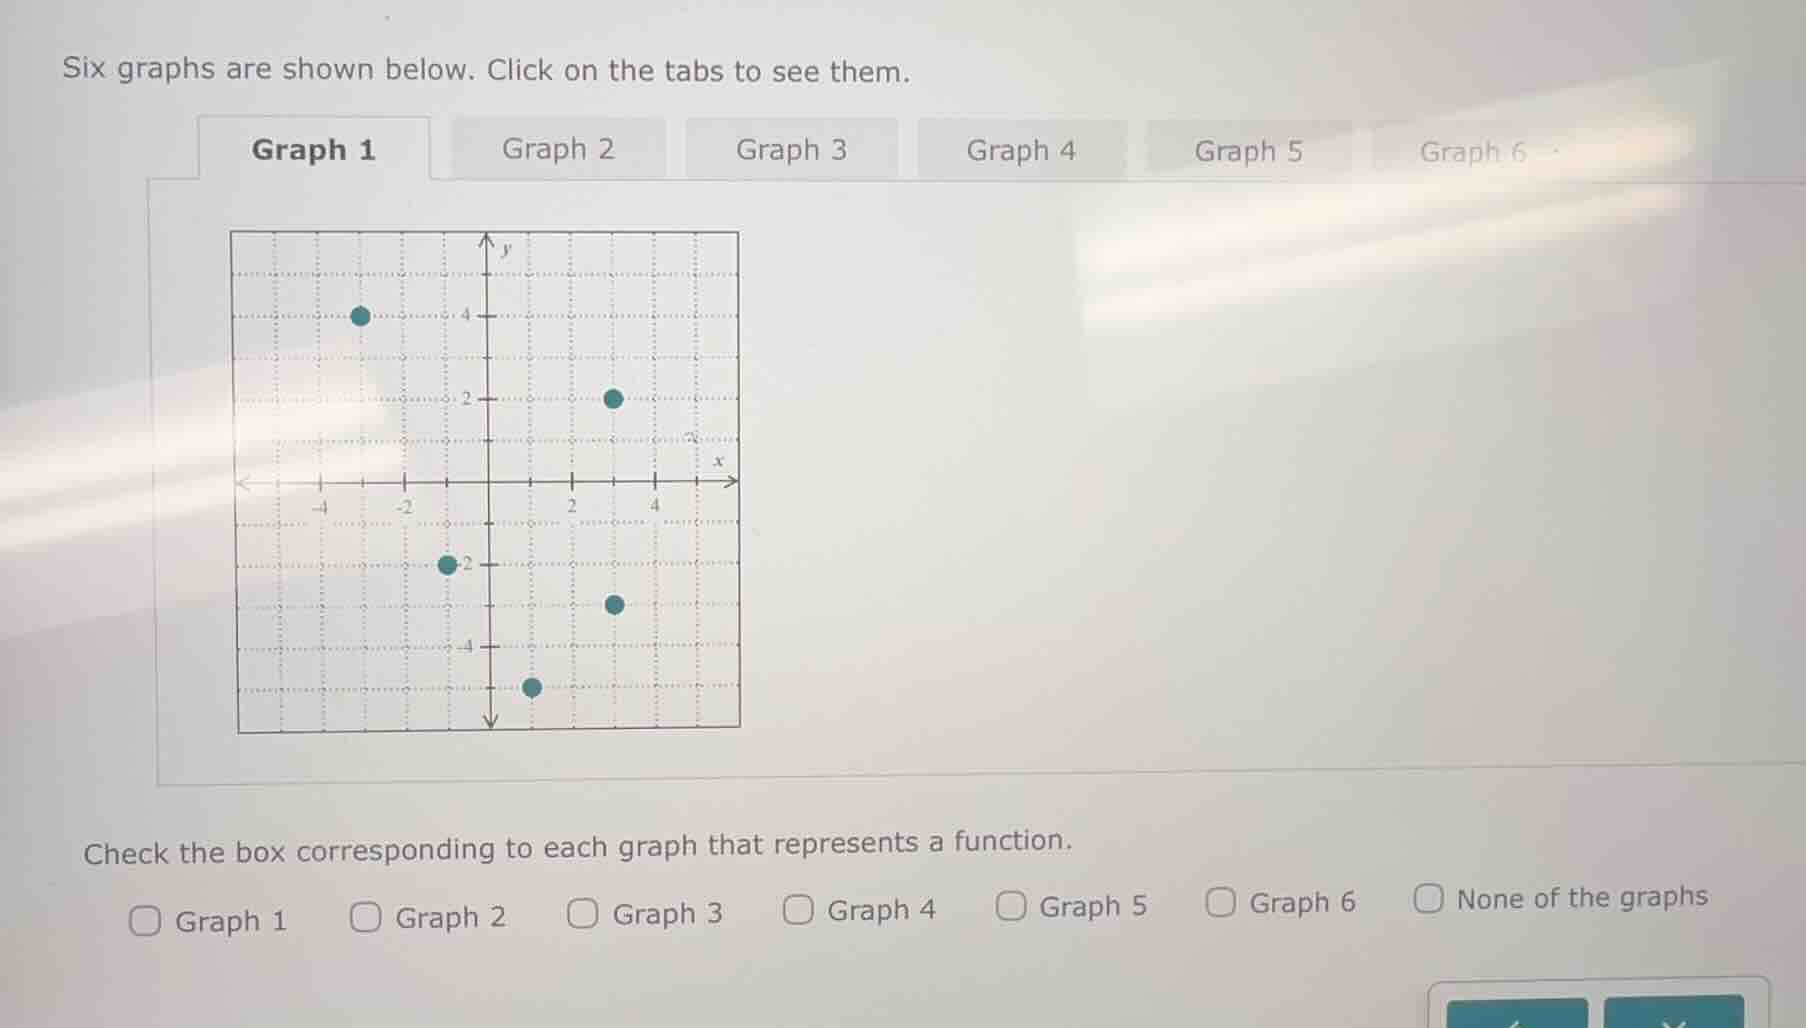
six graphs are shown below. click on the tabs to see them.
graph 1 graph 2 graph 3 graph 4 graph 5 graph 6
graph 1s coordinate plane with points
check the box corresponding to each graph that represents a function.
□ graph 1 □ graph 2 □ graph 3 □ graph 4 □ graph 5 □ graph 6 □ none of the graphs
To determine if a graph represents a function, we use the vertical line test: a graph is a function if no vertical line intersects it more than once.
Analyzing Graph 1:
For each \( x \)-value (horizontal coordinate) of the plotted points, check if there is only one \( y \)-value (vertical coordinate).
- The points in Graph 1 have \( x \)-values: \( -3 \), \( -1 \), \( 1 \), \( 3 \), \( 5 \) (assuming grid lines; each \( x \)-value is unique, so no vertical line will intersect more than one point). Thus, Graph 1 passes the vertical line test.
Since the problem asks to check the box for graphs that represent functions, and Graph 1 passes the vertical line test, we check its box. (Note: Without seeing Graphs 2–6, we can only confirm Graph 1 here, but the key is applying the vertical line test.)

Snap & solve any problem in the app
Get step-by-step solutions on Sovi AI
Photo-based solutions with guided steps
Explore more problems and detailed explanations
\(\boldsymbol{\square}\) Graph 1 (checked, as it passes the vertical line test)
(For Graphs 2–6, their analysis would follow the same vertical line test, but since they are not visible, we focus on Graph 1 as shown.)