QUESTION IMAGE
Question
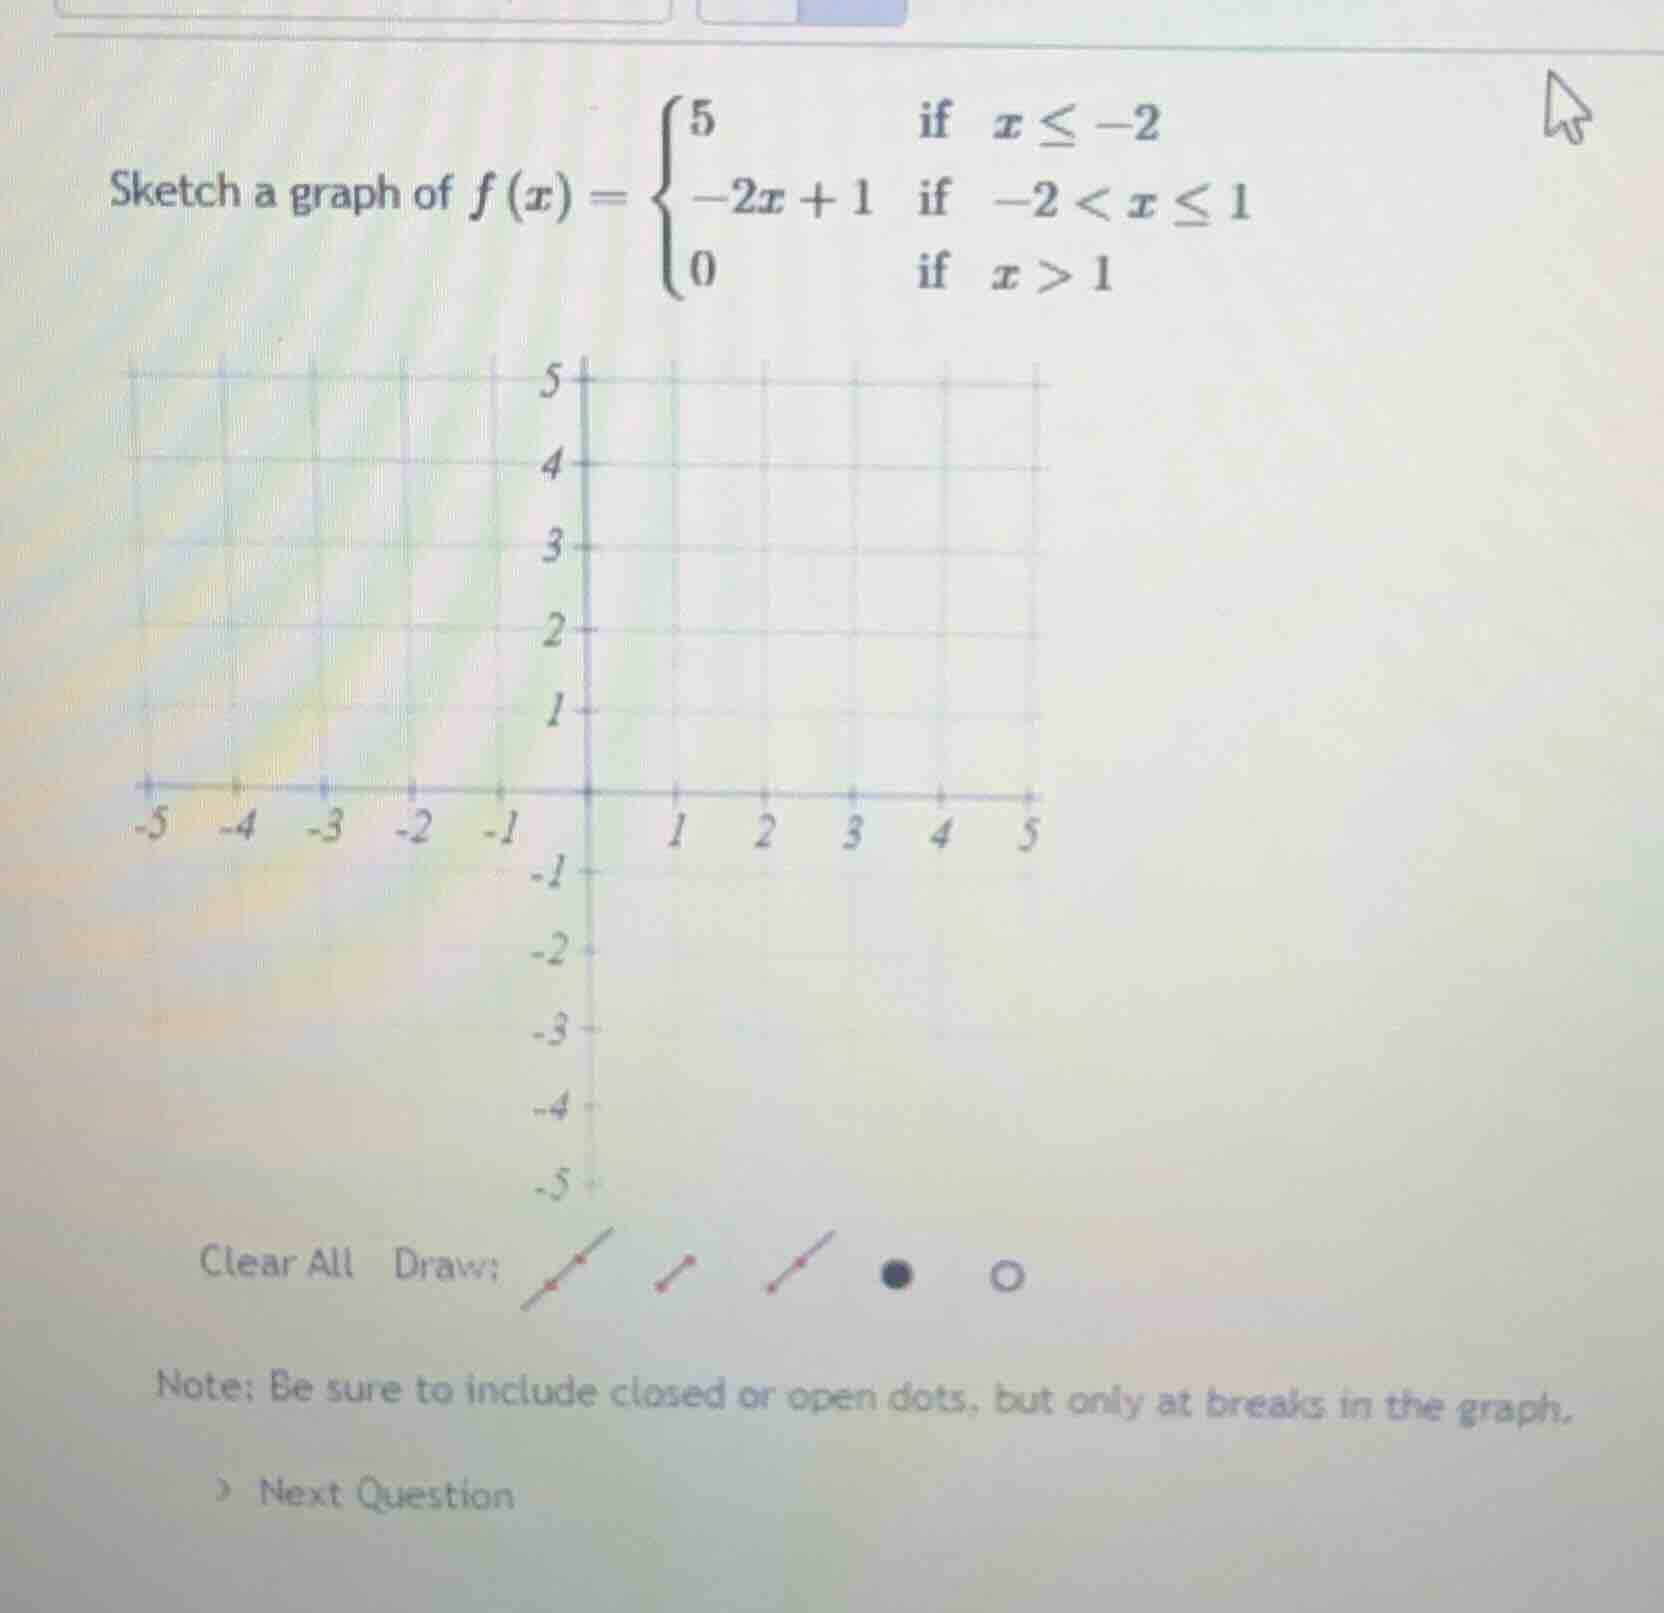
sketch a graph of $f(x)=\
$
clear all draw:
note: be sure to include closed or open dots, but only at breaks in the graph.
) next question
Step1: Analyze the first piece
For \( f(x) = 5 \) when \( x \leq -2 \), this is a horizontal line. At \( x = -2 \), we use a closed dot (since \( x \leq -2 \)) at the point \( (-2, 5) \), and the line extends to the left (for all \( x \leq -2 \)).
Step2: Analyze the second piece
For \( f(x) = -2x + 1 \) when \( -2 < x \leq 1 \), this is a linear function. First, find the endpoints:
- At \( x = -2 \) (open dot, since \( -2 < x \)), \( f(-2) = -2(-2)+1 = 5 \), so the open dot is at \( (-2, 5) \).
- At \( x = 1 \) (closed dot, since \( x \leq 1 \)), \( f(1) = -2(1)+1 = -1 \), so the closed dot is at \( (1, -1) \). Then, we can find another point, e.g., when \( x = 0 \), \( f(0) = -2(0)+1 = 1 \), so the point \( (0, 1) \) is on this line segment. We draw the line segment connecting these points with an open dot at \( (-2, 5) \) and closed dot at \( (1, -1) \).
Step3: Analyze the third piece
For \( f(x) = 0 \) when \( x > 1 \), this is a horizontal line. At \( x = 1 \), we use an open dot (since \( x > 1 \)) at the point \( (1, 0) \), and the line extends to the right (for all \( x > 1 \)).
To sketch:
- Draw a horizontal line at \( y = 5 \) from \( x = -\infty \) to \( x = -2 \), with a closed dot at \( (-2, 5) \).
- Draw the line segment of \( y = -2x + 1 \) from \( x = -2 \) (open dot at \( (-2, 5) \)) to \( x = 1 \) (closed dot at \( (1, -1) \)).
- Draw a horizontal line at \( y = 0 \) from \( x = 1 \) (open dot at \( (1, 0) \)) to \( x = \infty \).

Snap & solve any problem in the app
Get step-by-step solutions on Sovi AI
Photo-based solutions with guided steps
Explore more problems and detailed explanations
The graph consists of:
- A horizontal line \( y = 5 \) for \( x \leq -2 \) (closed dot at \( (-2, 5) \)).
- A line segment \( y = -2x + 1 \) for \( -2 < x \leq 1 \) (open dot at \( (-2, 5) \), closed dot at \( (1, -1) \)).
- A horizontal line \( y = 0 \) for \( x > 1 \) (open dot at \( (1, 0) \)).
(Note: Since the question asks to sketch, the above steps describe how to construct the graph. If a visual is needed, follow the step - by - step drawing instructions.)