QUESTION IMAGE
Question
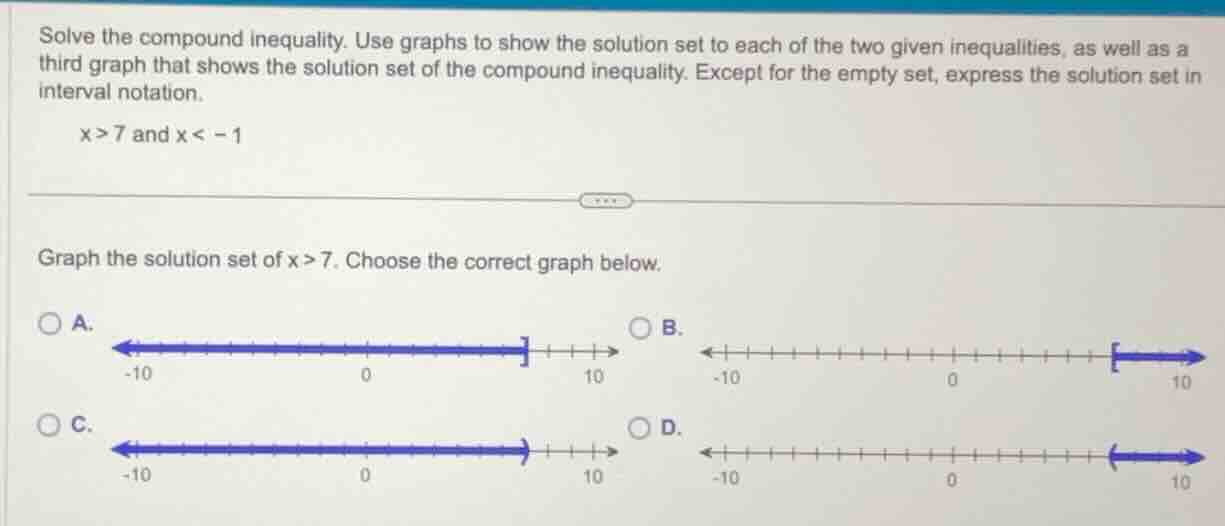
solve the compound inequality. use graphs to show the solution set to each of the two given inequalities, as well as a third graph that shows the solution set of the compound inequality. except for the empty set, express the solution set in interval notation.
x>7 and x < -1
graph the solution set of x>7. choose the correct graph below.
a.
-10 0 10
b.
-10 0 10
c.
-10 0 10
d.
-10 0 10
Step1: Analyze $x>7$ graph rules
For $x>7$, we use an open circle at 7 (since 7 is not included) and shade to the right (for values greater than 7).
Step2: Match to option
Compare with given graphs: Option D has an open circle at 7 and shading to the right, which matches.
Step3: Analyze compound inequality
The compound inequality is $x>7$ and $x<-1$. There are no numbers that are both greater than 7 and less than -1, so the solution set is empty.

Snap & solve any problem in the app
Get step-by-step solutions on Sovi AI
Photo-based solutions with guided steps
Explore more problems and detailed explanations
- Correct graph for $x>7$: D. <graph with open circle at 7, shading right>
- Solution set of the compound inequality $x>7$ and $x<-1$: $\emptyset$ (empty set)