QUESTION IMAGE
Question
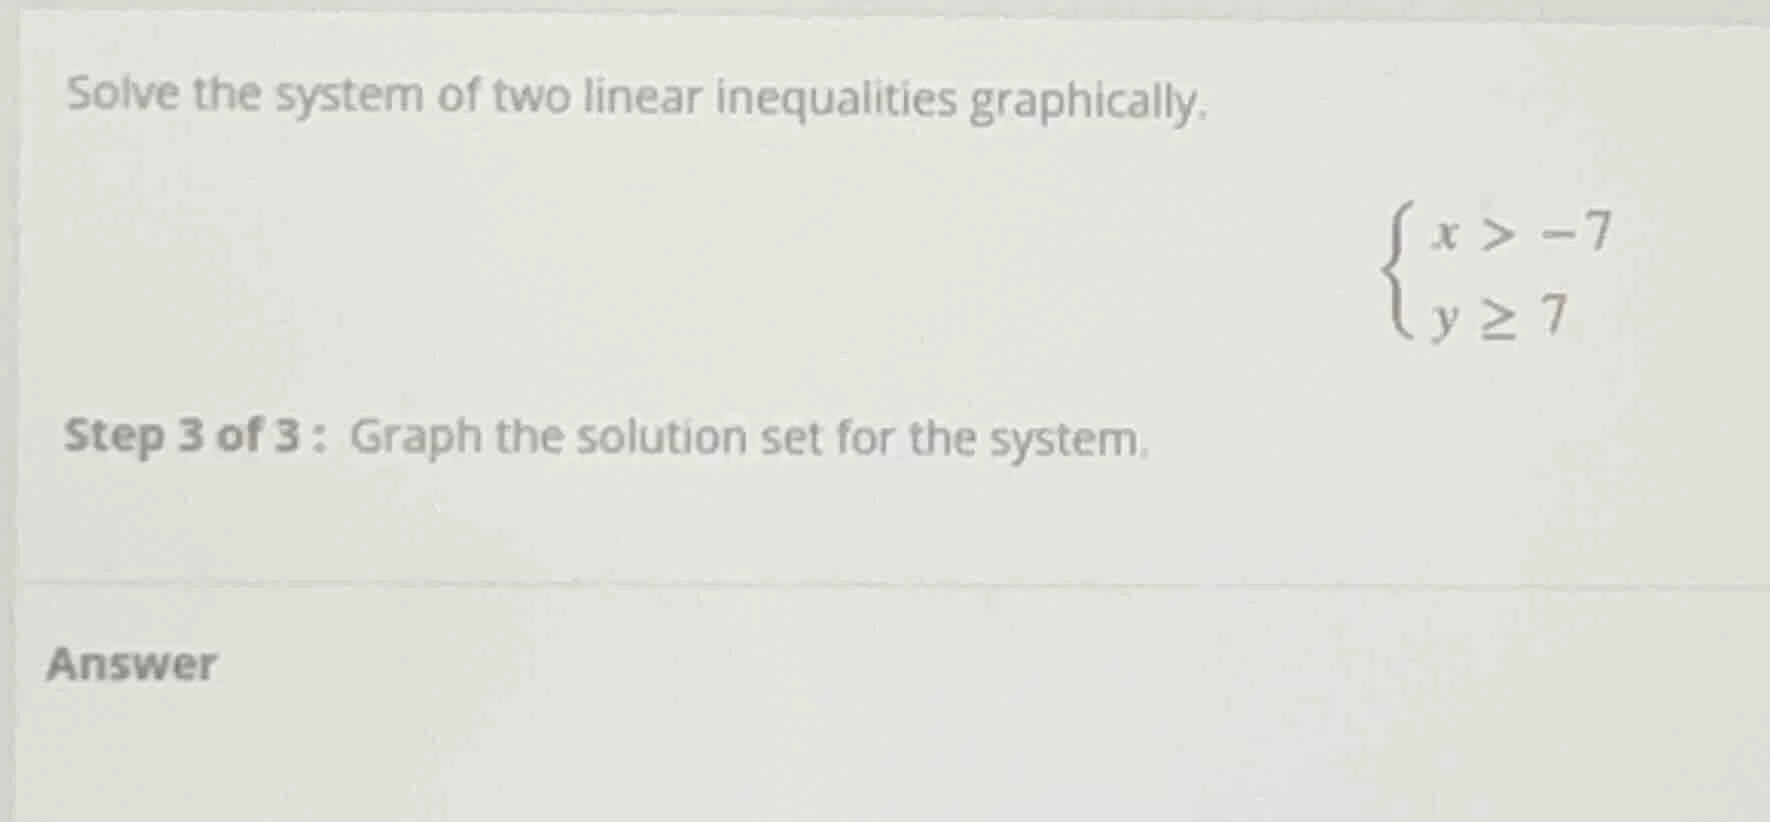
solve the system of two linear inequalities graphically.\
\
step 3 of 3 : graph the solution set for the system.\
answer
Step1: Graph boundary $x=-7$
Draw a dashed vertical line at $x=-7$ (dashed because the inequality is $x > -7$, so the line itself is not part of the solution). Shade the region to the right of this line (all points where $x$ is greater than -7).
Step2: Graph boundary $y=7$
Draw a solid horizontal line at $y=7$ (solid because the inequality is $y \geq 7$, so the line itself is part of the solution). Shade the region above this line (all points where $y$ is 7 or greater).
Step3: Identify overlapping region
The solution set is the intersection of the two shaded regions: all points to the right of $x=-7$ (dashed line) and above or on $y=7$ (solid line).

Snap & solve any problem in the app
Get step-by-step solutions on Sovi AI
Photo-based solutions with guided steps
Explore more problems and detailed explanations
The solution is the region that is:
- To the right of the dashed vertical line $x=-7$
- Above or on the solid horizontal line $y=7$
The overlapping shaded area represents all $(x,y)$ pairs that satisfy both inequalities.