QUESTION IMAGE
Question
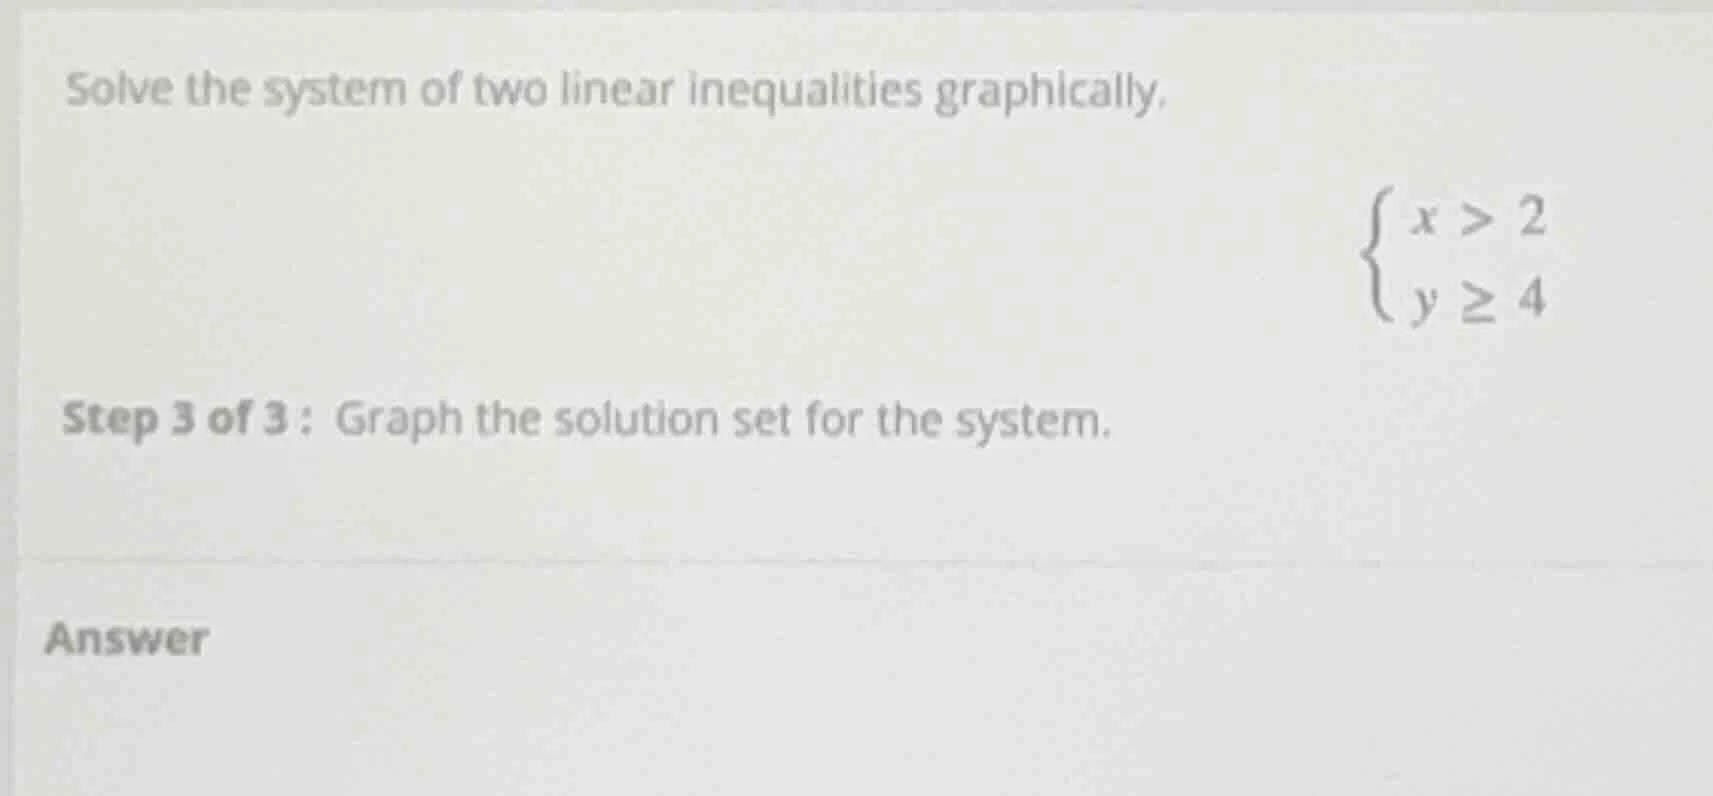
solve the system of two linear inequalities graphically.\
\
step 3 of 3: graph the solution set for the system.\
answer
Step1: Graph boundary $x=2$
Draw a dashed vertical line at $x=2$ (dashed because $x>2$ does not include equality).
Step2: Shade region for $x>2$
Shade all areas to the right of the line $x=2$.
Step3: Graph boundary $y=4$
Draw a solid horizontal line at $y=4$ (solid because $y\geq4$ includes equality).
Step4: Shade region for $y\geq4$
Shade all areas above and including the line $y=4$.
Step5: Identify overlapping region
The solution set is the intersection of the two shaded regions: the area to the right of $x=2$ and above/on $y=4$.

Snap & solve any problem in the app
Get step-by-step solutions on Sovi AI
Photo-based solutions with guided steps
Explore more problems and detailed explanations
The solution set is the region that is to the right of the dashed line $x=2$ and above or on the solid line $y=4$. Visually, this is the top-right quadrant-like area bounded by these two lines.