QUESTION IMAGE
Question
solving linear inequalities quick check
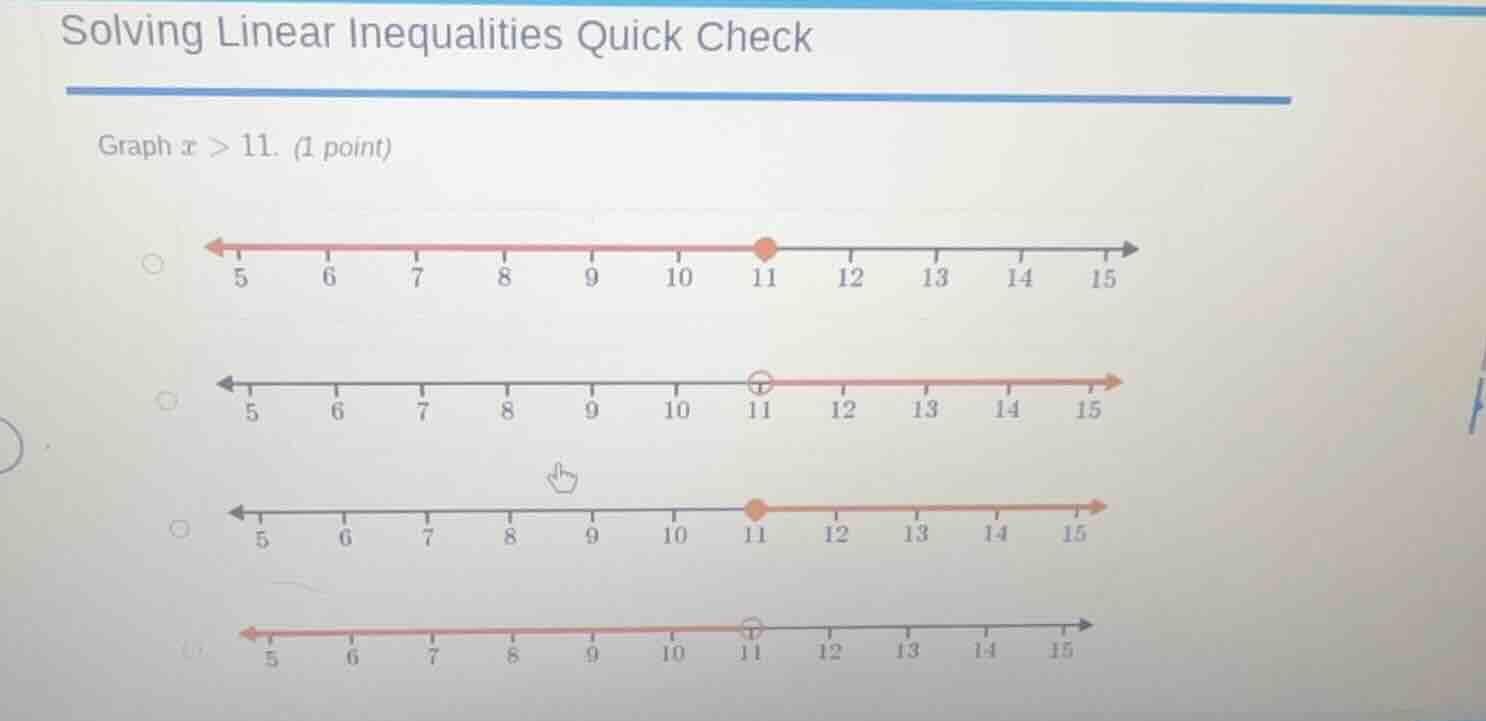
graph ( x > 11 ). (1 point)
four number line graphs are shown as options, with the first having a filled dot at 11 and red line to the left, the second having an open dot at 11 and red line to the right, the third having a filled dot at 11 and red line to the right, the fourth having an open dot at 11 and red line to the left
Step1: Analyze the inequality \( x > 11 \)
The inequality \( x > 11 \) means that \( x \) can take any value greater than 11, but not equal to 11. So, on a number line, we use an open circle at 11 (to show that 11 is not included) and shade the region to the right of 11 (since we want values greater than 11).
Step2: Evaluate each graph
- First graph: Has a closed circle at 11 and shades left, which would represent \( x \leq 11 \), so incorrect.
- Second graph: Has an open circle at 11 and shades right, which matches \( x > 11 \).
- Third graph: Has a closed circle at 11 and shades right, which would represent \( x \geq 11 \), so incorrect.
- Fourth graph: Has an open circle at 11 and shades left, which would represent \( x < 11 \), so incorrect.

Snap & solve any problem in the app
Get step-by-step solutions on Sovi AI
Photo-based solutions with guided steps
Explore more problems and detailed explanations
The second graph (with open circle at 11 and shading to the right)