QUESTION IMAGE
Question
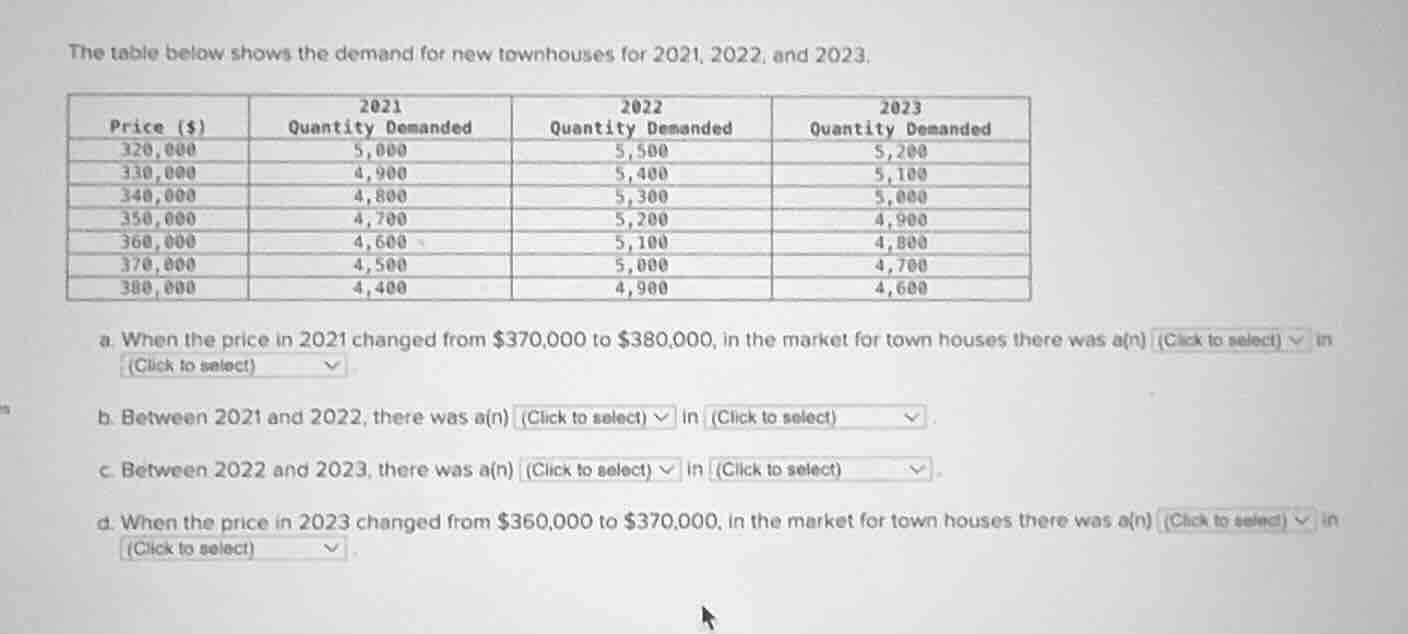
the table below shows the demand for new townhouses for 2021, 2022, and 2023.
| price ($) | 2021 quantity demanded | 2022 quantity demanded | 2023 quantity demanded |
|---|---|---|---|
| 330,000 | 4,900 | 5,400 | 5,100 |
| 340,000 | 4,800 | 5,300 | 5,000 |
| 350,000 | 4,700 | 5,200 | 4,900 |
| 360,000 | 4,600 | 5,100 | 4,800 |
| 370,000 | 4,500 | 5,000 | 4,700 |
| 380,000 | 4,400 | 4,900 | 4,600 |
a. when the price in 2021 changed from $370,000 to $380,000, in the market for town houses there was a(n) (click to select) in (click to select)
b. between 2021 and 2022, there was a(n) (click to select) in (click to select)
c. between 2022 and 2023, there was a(n) (click to select) in (click to select)
d. when the price in 2023 changed from $350,000 to $370,000, in the market for town houses there was a(n) (click to select) in (click to select)
Step1: Analyze 2021 price change
When price rises from $370,000 to $380,000 in 2021, quantity demanded falls from 4,500 to 4,400. This is a movement along the demand curve: increase in price, decrease in quantity demanded.
Step2: Analyze 2021-2022 shift
At every price level, 2022 quantity demanded is higher than 2021 (e.g., $320k: 5,000→5,500; $380k: 4,400→4,900). This is a rightward shift of the demand curve: increase in demand.
Step3: Analyze 2022-2023 shift
At every price level, 2023 quantity demanded is lower than 2022 (e.g., $320k: 5,500→5,200; $380k: 4,900→4,600). This is a leftward shift of the demand curve: decrease in demand.
Step4: Analyze 2023 price change
When price rises from $360,000 to $370,000 in 2023, quantity demanded falls from 4,800 to 4,700. This is a movement along the demand curve: increase in price, decrease in quantity demanded.

Snap & solve any problem in the app
Get step-by-step solutions on Sovi AI
Photo-based solutions with guided steps
Explore more problems and detailed explanations
a. increase; quantity demanded
b. increase; demand
c. decrease; demand
d. increase; quantity demanded