QUESTION IMAGE
Question
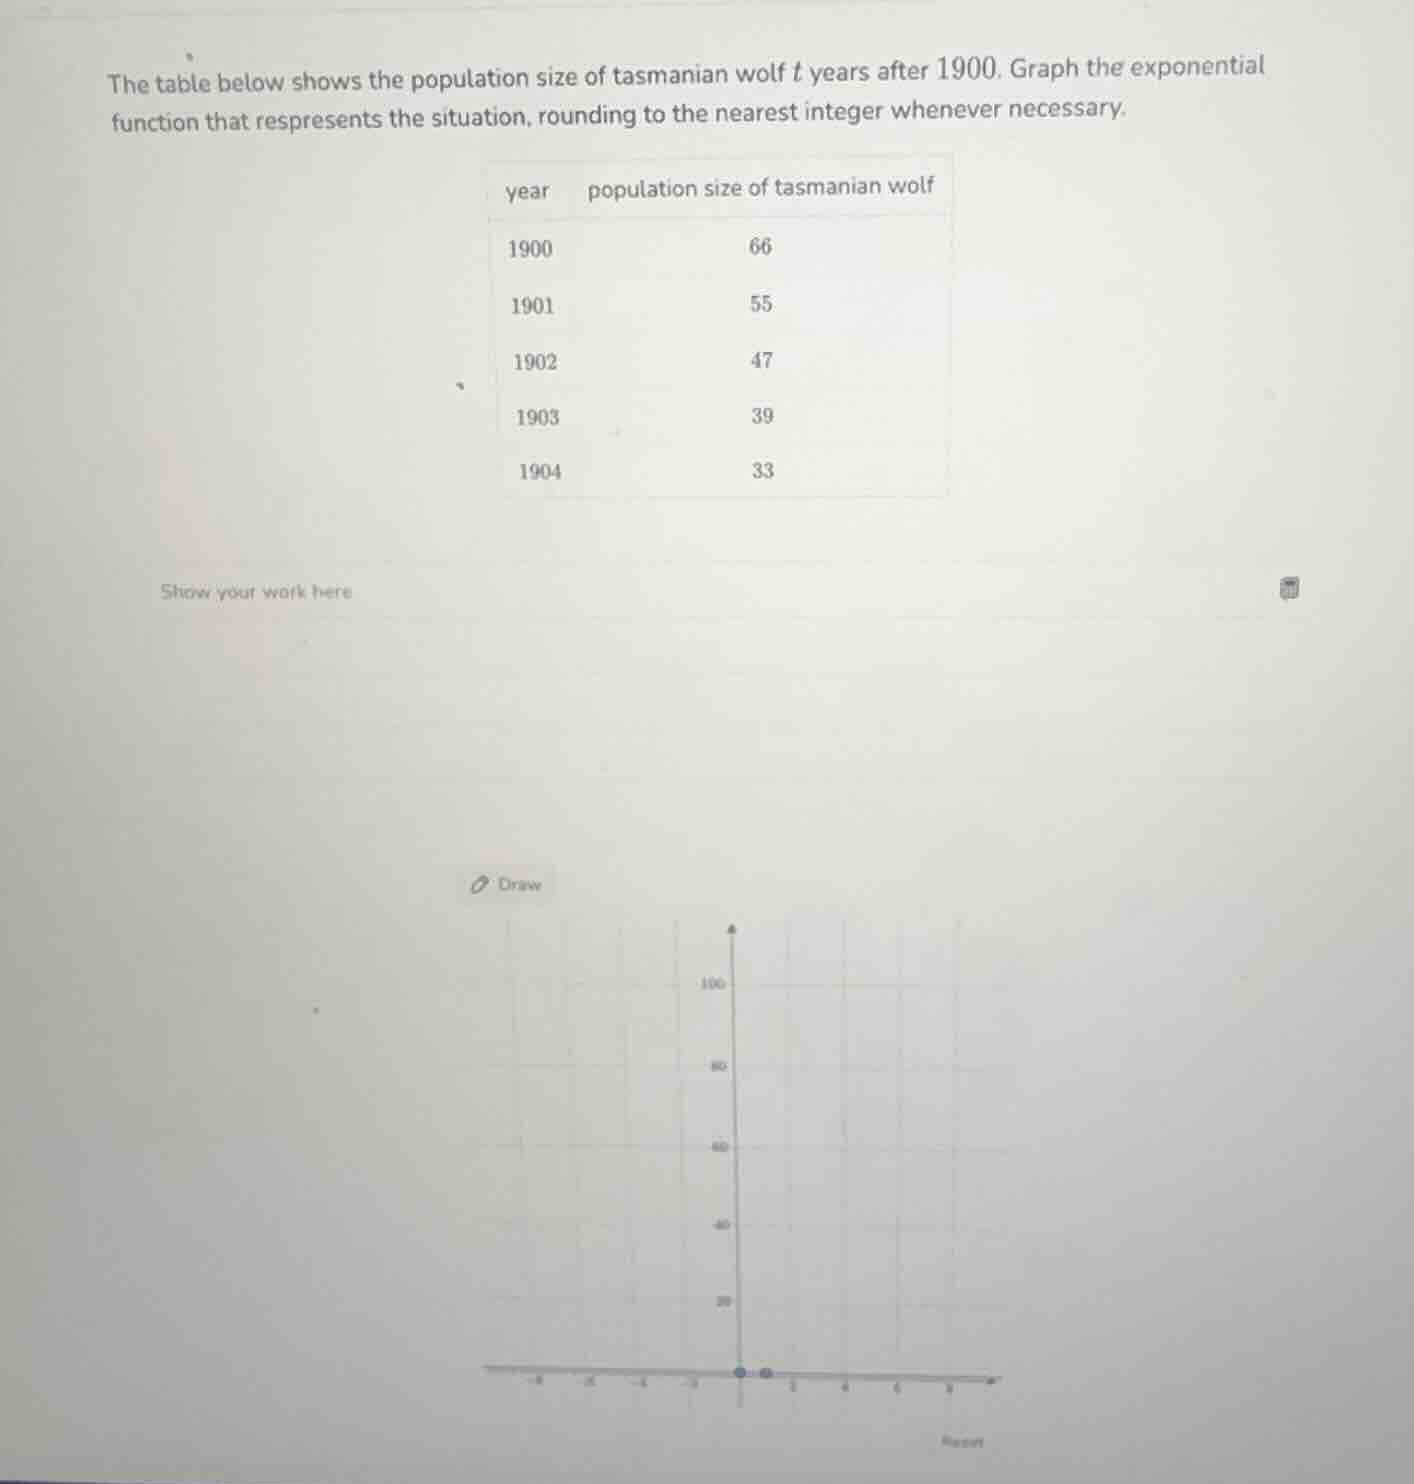
the table below shows the population size of tasmanian wolf $t$ years after 1900. graph the exponential function that respresents the situation, rounding to the nearest integer whenever necessary.
| year | population size of tasmanian wolf | ---- | ---- | 1900 | 66 | 1901 | 55 | 1902 | 47 | 1903 | 39 | 1904 | 33 |
show your work here
draw
Step1: Define exponential decay model
The general exponential decay function is $P(t) = P_0 \cdot r^t$, where $P_0$ is the initial population, $r$ is the decay rate, and $t$ is years after 1900.
Step2: Identify initial population
In 1900 ($t=0$), $P_0 = 66$.
Step3: Calculate decay rate $r$
Use 1901 data ($t=1$, $P=55$):
$r = \frac{P(1)}{P_0} = \frac{55}{66} \approx 0.833$
Verify with 1902: $66 \cdot (0.833)^2 \approx 66 \cdot 0.694 \approx 46.8 \approx 47$, which matches the table.
Step4: Finalize the function
$P(t) = 66 \cdot (0.833)^t$
Step5: List plot points
Calculate (or use given) points:
- $t=0$: $P=66$
- $t=1$: $P=55$
- $t=2$: $P=47$
- $t=3$: $P=39$
- $t=4$: $P=33$

Snap & solve any problem in the app
Get step-by-step solutions on Sovi AI
Photo-based solutions with guided steps
Explore more problems and detailed explanations
The exponential function is $P(t) = 66 \cdot (0.833)^t$. To graph:
- Label the x-axis "Years after 1900 ($t$)" and y-axis "Population Size".
- Plot the points $(0, 66)$, $(1, 55)$, $(2, 47)$, $(3, 39)$, $(4, 33)$.
- Draw a smooth curve through the points, trending downward as $t$ increases.