QUESTION IMAGE
Question
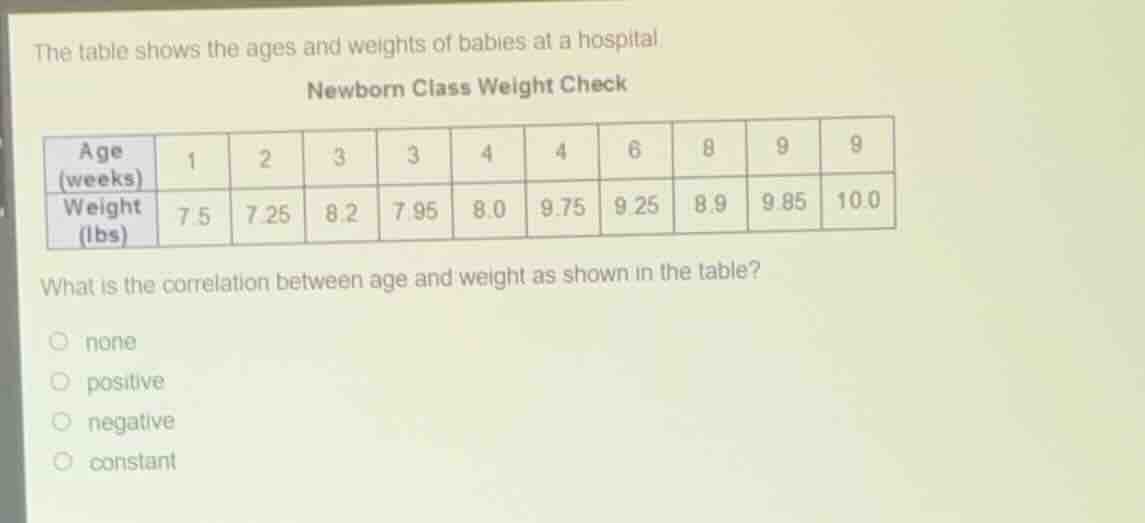
the table shows the ages and weights of babies at a hospital. newborn class weight check age (weeks) 1 2 3 3 4 4 6 8 9 9 weight (lbs) 7.5 7.25 8.2 7.95 8.0 9.75 9.25 8.9 9.85 10.0 what is the correlation between age and weight as shown in the table? none positive negative constant
To determine the correlation, we analyze the trend between age (in weeks) and weight (in lbs). As the age of the babies increases (from 1 week to 9 weeks), the weight generally increases (e.g., at 1 week weight is 7.5 lbs, at 9 weeks it's 10.0 lbs; most data points show an upward trend). A positive correlation exists when an increase in one variable (age) is associated with an increase in the other variable (weight). There's no constant weight (values vary) and no negative correlation (weight doesn't decrease with increasing age). So the correlation is positive.

Snap & solve any problem in the app
Get step-by-step solutions on Sovi AI
Photo-based solutions with guided steps
Explore more problems and detailed explanations
positive