QUESTION IMAGE
Question
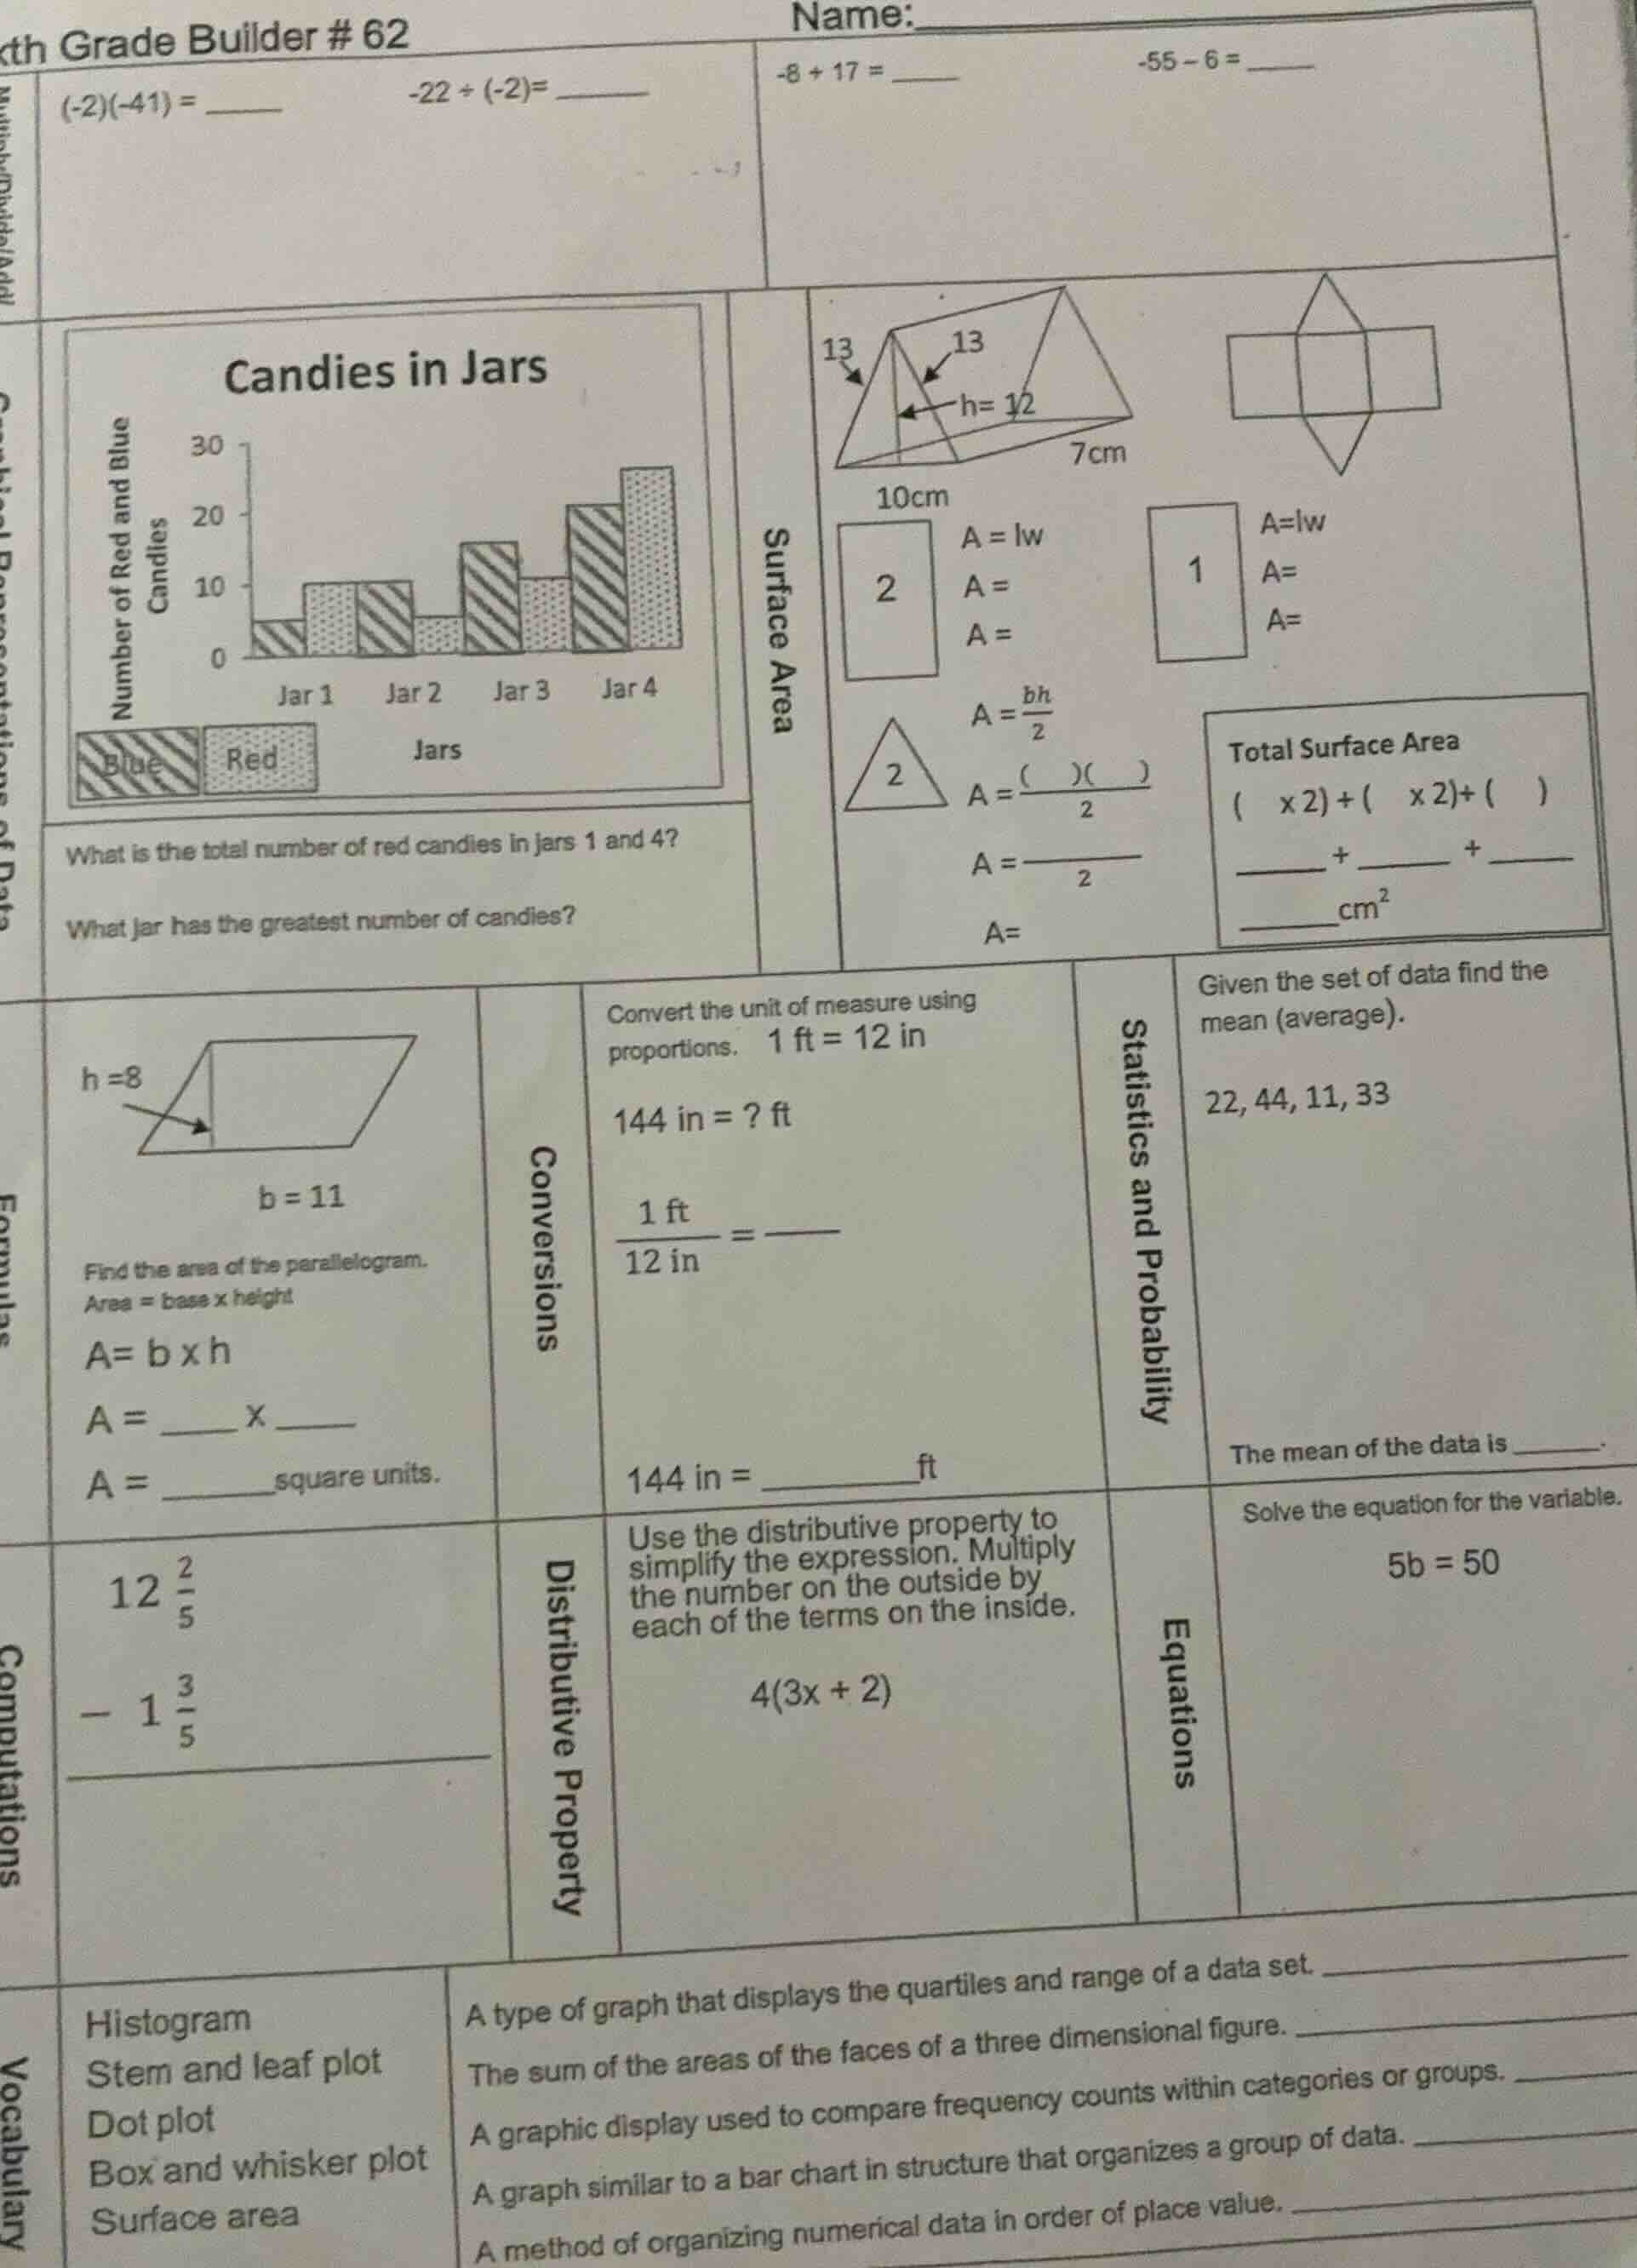
th grade builder # 62
name:
$(-2)(-41) = $
$-22 \div (-2)=$
$-8 + 17 = $
$-55 - 6 = $
candies in jars
what is the total number of red candies in jars 1 and 4?
what jar has the greatest number of candies?
surface area
10cm, 7cm, 13, 13, h=12
$a = lw$
$a = lw$
$a = $
$a=
a = \frac{bh}{2}$
$a = \frac{(\quad)(\quad)}{2}$
$a = \frac{\quad}{2}$
$a=$
total surface area
( $\times 2$) + ( $\times 2$)+ ( )
$\quad + \quad + \quad$
$\quad$cm$^2$
$h =8$
$b = 11$
find the area of the parallelogram.
area = base x height
$a= b \times h$
$a = \quad \times \quad$
$a = \quad$square units.
conversions
convert the unit of measure using proportions. $1$ ft = $12$ in
$144$ in =? ft
$\frac{1\text{ ft}}{12\text{ in}} = $
$144$ in = $\quad$ft
statistics and probability
given the set of data find the mean (average).
22, 44, 11, 33
the mean of the data is $\quad$.
$12\frac{2}{5}$
$- 1\frac{3}{5}$
distributive property
use the distributive property to simplify the expression. multiply the number on the outside by each of the terms on the inside.
$4(3x + 2)$
equations
solve the equation for the variable.
$5b = 50$
vocabulary
histogram
stem and leaf plot
dot plot
box and whisker plot
surface area
a type of graph that displays the quartiles and range of a data set. $
the sum of the areas of the faces of a three dimensional figure. $
a graphic display used to compare frequency counts within categories or groups. $
a graph similar to a bar chart in structure that organizes a group of data. $
a method of organizing numerical data in order of place value. $
Step1: Multiply two negative numbers
$(-2)(-41) = 82$
Step2: Divide two negative numbers
$-22 \div (-2) = 11$
Step3: Add negative and positive numbers
$-8 + 17 = 9$
Step4: Subtract from a negative number
$-55 - 6 = -61$
---
Step1: Read red candies from graph
Jar1 red: 10, Jar4 red: 25
Step2: Sum the red candies
$10 + 25 = 35$
Step3: Calculate total candies per jar
Jar1: $5+10=15$, Jar2: $10+5=15$, Jar3: $15+10=25$, Jar4: $20+25=45$
Step4: Identify jar with max candies
Jar4 has the highest total
---
Step1: Calculate area of rectangles
Rect1: $A = 10 \times 7 = 70$
Rect2: $A = 13 \times 7 = 91$
Step2: Calculate area of triangles
$A = \frac{10 \times 12}{2} = 60$
Step3: Sum all surface areas
$(70 \times 2) + (91 \times 2) + (60 \times 2) = 140 + 182 + 120 = 442$
---
Step1: Plug values into area formula
$A = b \times h = 11 \times 8$
Step2: Compute the area
$A = 88$
---
Step1: Set up conversion proportion
$\frac{1\ \text{ft}}{12\ \text{in}} = \frac{x}{144\ \text{in}}$
Step2: Solve for x
$x = \frac{144}{12} = 12$
---
Step1: Sum all data values
$22 + 44 + 11 + 33 = 110$
Step2: Divide by number of values
$\text{Mean} = \frac{110}{4} = 27.5$
---
Step1: Subtract mixed fractions
$12\frac{2}{5} - 1\frac{3}{5} = 11\frac{7}{5} - 1\frac{3}{5}$
Step2: Compute the result
$10\frac{4}{5}$
---
Step1: Apply distributive property
$4(3x + 2) = 4(3x) + 4(2)$
Step2: Simplify the expression
$12x + 8$
---
Step1: Isolate the variable b
$b = \frac{50}{5}$
Step2: Solve for b
$b = 10$
---
Step1: Match terms to definitions
- A type of graph that displays the quartiles and range of a data set: Box and whisker plot
- The sum of the areas of the faces of a three dimensional figure: Surface area
- A graphic display used to compare frequency counts within categories or groups: Dot plot
- A graph similar to a bar chart in structure that organizes a group of data: Histogram
- A method of organizing numerical data in order of place value: Stem and leaf plot

Snap & solve any problem in the app
Get step-by-step solutions on Sovi AI
Photo-based solutions with guided steps
Explore more problems and detailed explanations
Multiply/Divide/Add:
$(-2)(-41) = 82$
$-22 \div (-2) = 11$
$-8 + 17 = 9$
$-55 - 6 = -61$
Candies in Jars:
Total red candies in Jars 1 and 4: 35
Jar with the greatest number of candies: Jar 4
Surface Area:
Rectangle 1: $A = 10 \times 7 = 70$
Rectangle 2: $A = 13 \times 7 = 91$
Triangle: $A = \frac{10 \times 12}{2} = 60$
Total Surface Area: $(70 \times 2) + (91 \times 2) + (60 \times 2) = 140 + 182 + 120 = 442\ \text{cm}^2$
Formulas (Parallelogram):
$A = 11 \times 8$
$A = 88$ square units
Conversions:
$\frac{1\ \text{ft}}{12\ \text{in}} = \frac{12}{144}$
$144\ \text{in} = 12\ \text{ft}$
Statistics and Probability:
The mean of the data is $27.5$
Computations:
$12\frac{2}{5} - 1\frac{3}{5} = 10\frac{4}{5}$
Distributive Property:
$4(3x + 2) = 12x + 8$
Equations:
$5b = 50 \implies b = 10$
Vocabulary:
- A type of graph that displays the quartiles and range of a data set: Box and whisker plot
- The sum of the areas of the faces of a three dimensional figure: Surface area
- A graphic display used to compare frequency counts within categories or groups: Dot plot
- A graph similar to a bar chart in structure that organizes a group of data: Histogram
- A method of organizing numerical data in order of place value: Stem and leaf plot