QUESTION IMAGE
Question
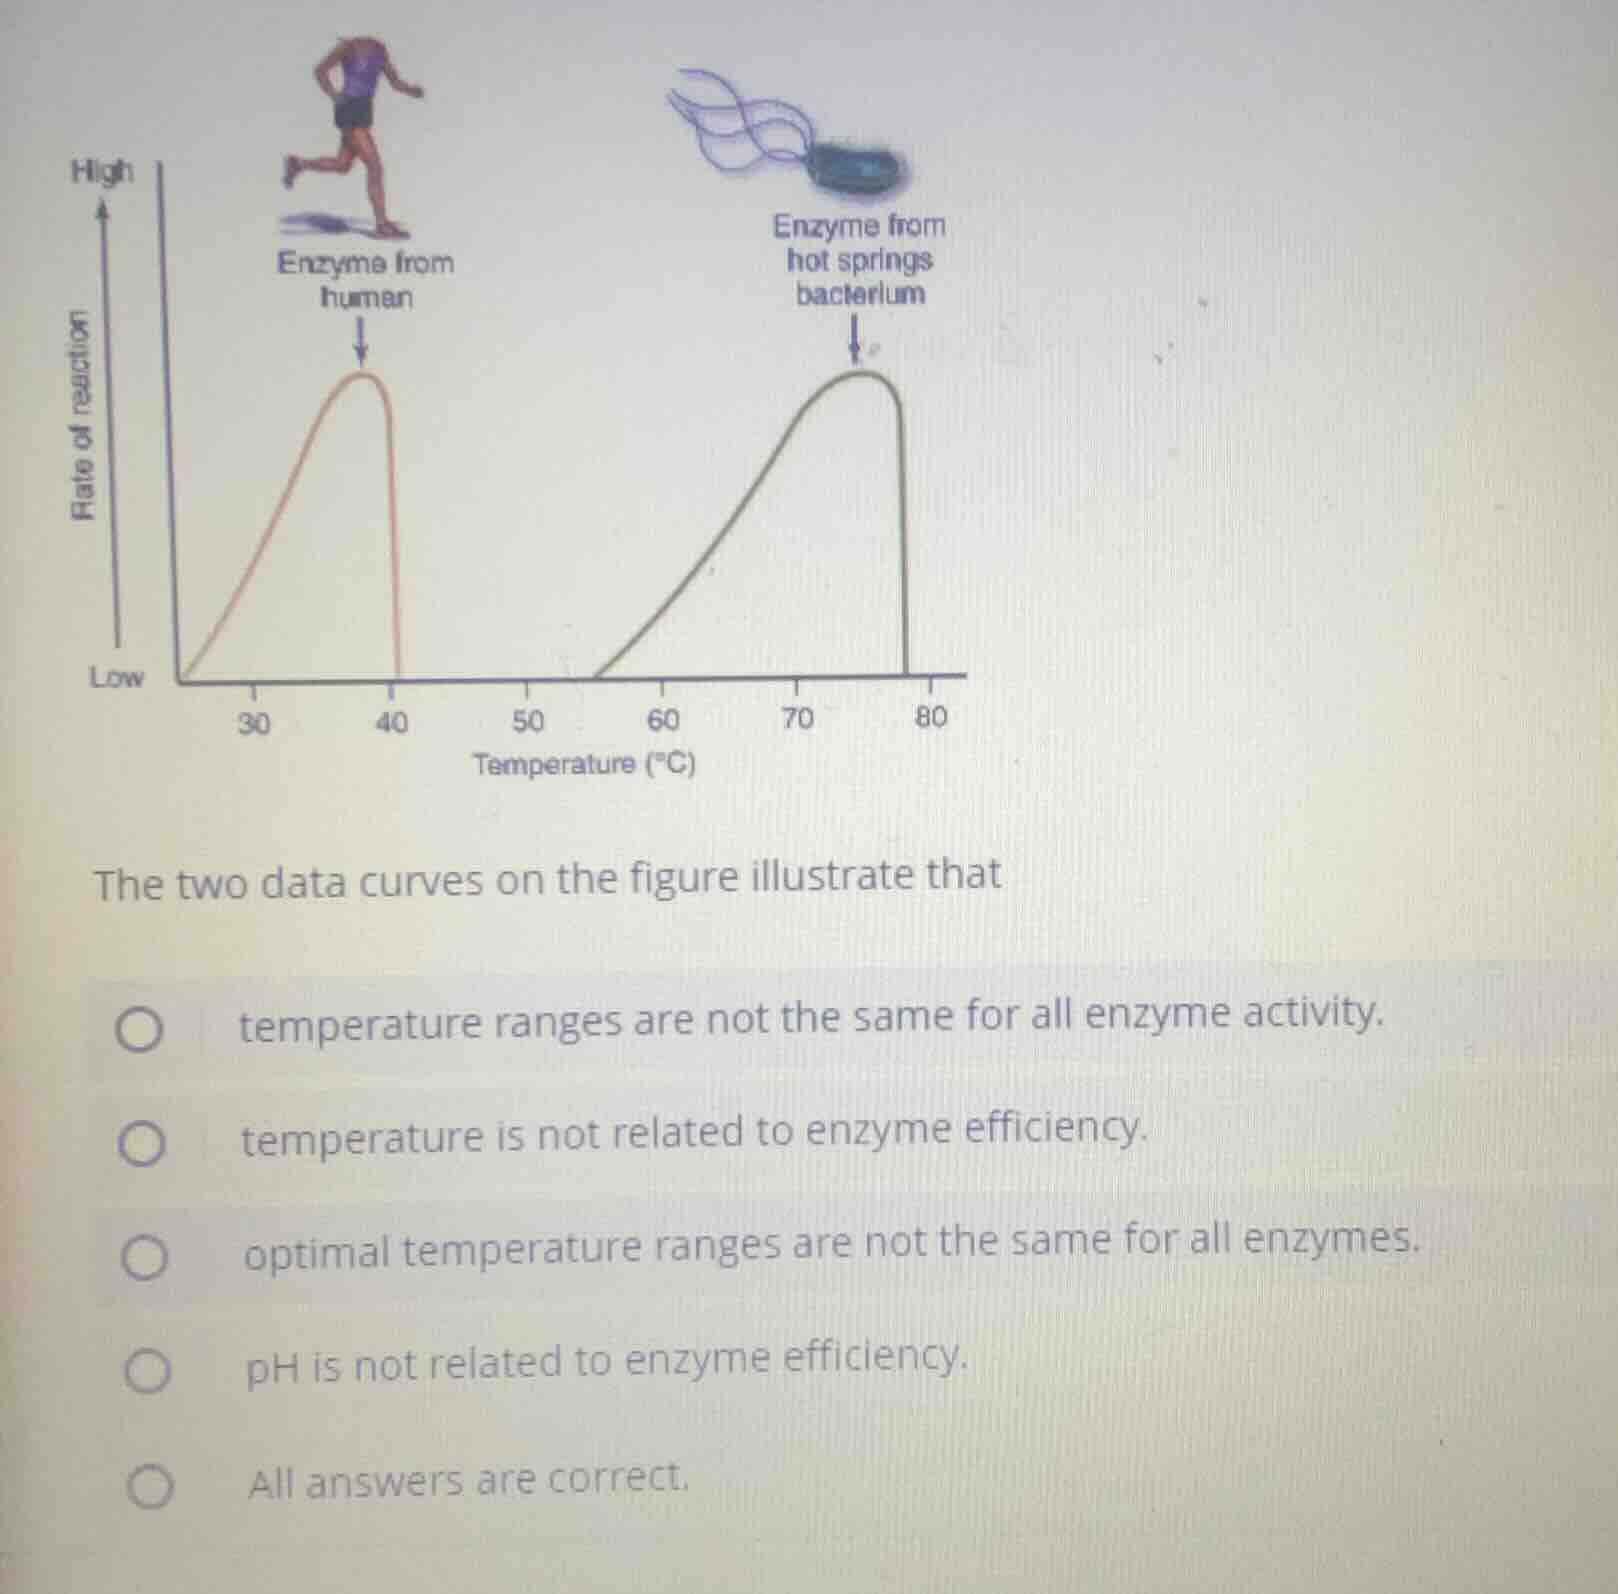
the two data curves on the figure illustrate that
temperature ranges are not the same for all enzyme activity.
temperature is not related to enzyme efficiency.
optimal temperature ranges are not the same for all enzymes.
ph is not related to enzyme efficiency.
all answers are correct.
Brief Explanations
- Analyze Option 1: The graph shows enzyme activity vs temperature, not just temperature ranges. The key is optimal ranges, so this is not the best.
- Analyze Option 2: The graph clearly shows temperature affects enzyme rate (reaction), so this is incorrect.
- Analyze Option 3: The human enzyme has an optimal temp around 35 - 40°C, and the hot springs bacterium enzyme around 70 - 80°C. So optimal temperature ranges differ between enzymes, this matches.
- Analyze Option 4: The graph is about temperature, not pH, so this is irrelevant.
- Analyze Option 5: Since other options are incorrect, this is wrong.

Snap & solve any problem in the app
Get step-by-step solutions on Sovi AI
Photo-based solutions with guided steps
Explore more problems and detailed explanations
C. optimal temperature ranges are not the same for all enzymes.