QUESTION IMAGE
Question
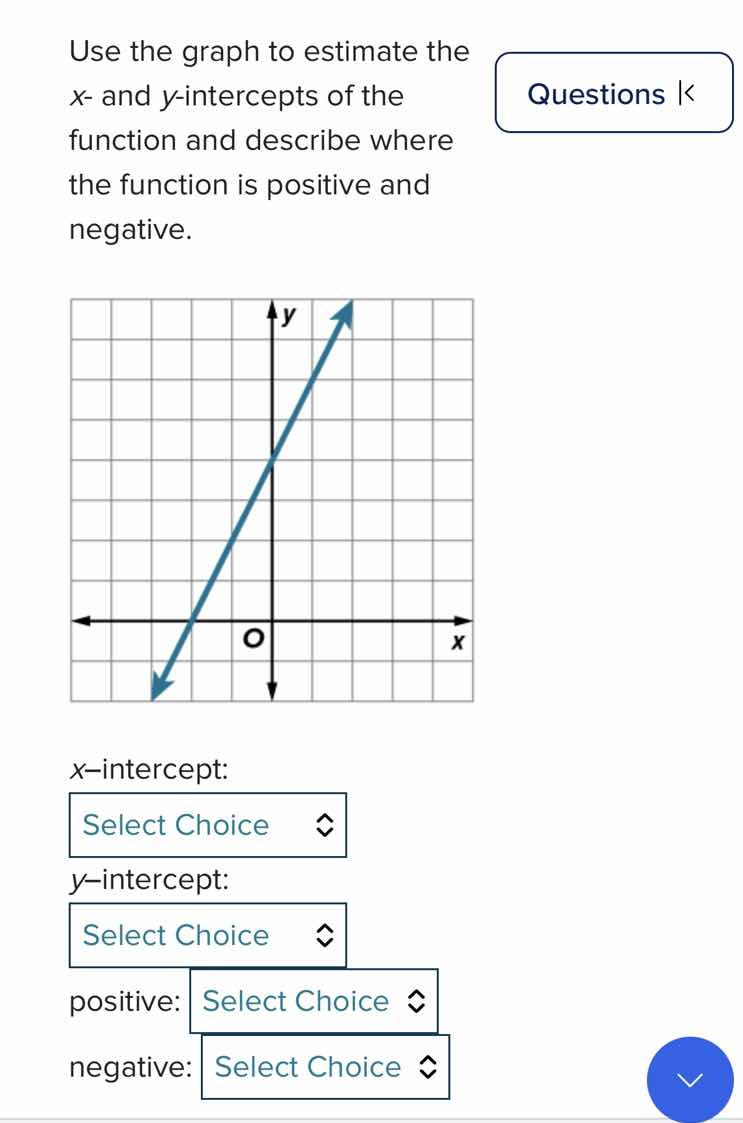
use the graph to estimate the x- and y-intercepts of the function and describe where the function is positive and negative. x–intercept: select choice y–intercept: select choice positive: select choice negative: select choice
Step1: Identify x-intercept
The x-intercept is where the graph crosses the x - axis. From the graph, the line crosses the x - axis at \(x=- 1\) (assuming each grid square is 1 unit). So the x - intercept is the point \((-1,0)\), so the x - intercept value (the x - coordinate) is \(-1\).
Step2: Identify y-intercept
The y - intercept is where the graph crosses the y - axis. From the graph, the line crosses the y - axis at \(y = 2\) (assuming each grid square is 1 unit). So the y - intercept is the point \((0,2)\), so the y - intercept value (the y - coordinate) is \(2\).
Step3: Determine where the function is positive
A function is positive when its graph is above the x - axis. For this linear function, since the slope is positive (the line is increasing from left to right), the function is above the x - axis when \(x>-1\) (because it crosses the x - axis at \(x = - 1\)).
Step4: Determine where the function is negative
A function is negative when its graph is below the x - axis. For this linear function, the function is below the x - axis when \(x<-1\) (because it crosses the x - axis at \(x=-1\)).

Snap & solve any problem in the app
Get step-by-step solutions on Sovi AI
Photo-based solutions with guided steps
Explore more problems and detailed explanations
x - intercept: \(-1\)
y - intercept: \(2\)
positive: \(x > - 1\)
negative: \(x < - 1\)